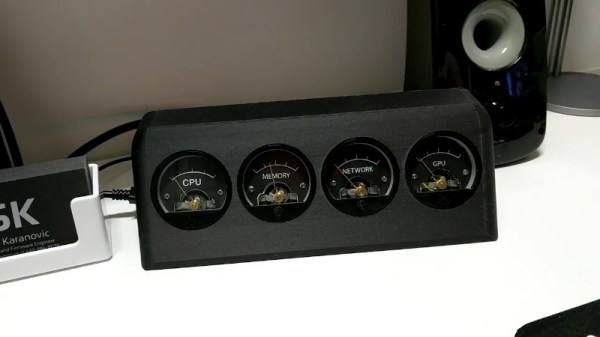
Keeping an eye on your computer’s resource utilization can be useful, particularly if you’re regularly doing computationally intensive tasks. While it’s entirely possible to achieve this with software tools, creating a dedicated hardware monitor can be cool too. [Sasa Karanovic] did just that, with a set of old-school analog gauges.
The build uses an STM32 microcontroller to drive a series of four galvanometers through an MCP4728 digital-to-analog converter. Data on CPU, memory, network and GPU utilization is collected by a Python script, and sent over a USB serial connection. This data drives the four-channel DAC, which in turn creates the voltages which control the needle position on the gauges. Aesthetically, the build features a few nice touches, including custom gauge faces and a 3D printed enclosure with a tasteful matte finish. A custom PCB keeps the electronics and wiring neat and tidy.
[Sasa] does a great job of explaining the basic theory of the device, as well as practical considerations for working with galvanometer-based gauges. It would make a great weekend project for anyone seeking to add some vintage charm to their desktop rig. There’s also scope to monitor other variables, like hard drive usage or CPU temperature. There’s bonus points if you integrate this into a laptop; the tip line would love to know. We’ve seen LED-based monitoring systems before, too. Video after the break.
Continue reading “Analog Gauges Keep An Eye On Computer Performance”


