Analog Gauges Keep An Eye On Computer Performance

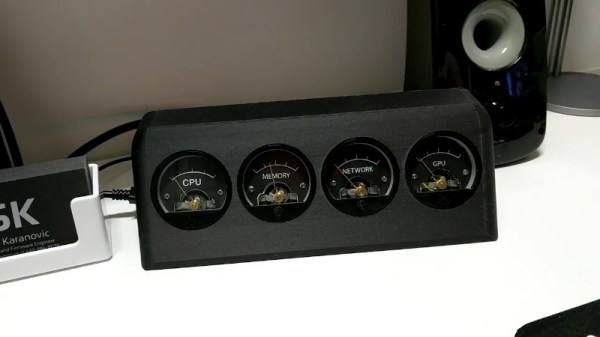
Keeping an eye on your computer’s resource utilization can be useful, particularly if you’re regularly doing computationally intensive tasks. While it’s entirely possible to achieve this with software tools, creating a dedicated hardware monitor can be cool too. [Sasa Karanovic] did just that, with a set of old-school analog gauges.

The build uses an STM32 microcontroller to drive a series of four galvanometers through an MCP4728 digital-to-analog converter. Data on CPU, memory, network and GPU utilization is collected by a Python script, and sent over a USB serial connection. This data drives the four-channel DAC, which in turn creates the voltages which control the needle position on the gauges. Aesthetically, the build features a few nice touches, including custom gauge faces and a 3D printed enclosure with a tasteful matte finish. A custom PCB keeps the electronics and wiring neat and tidy.

[Sasa] does a great job of explaining the basic theory of the device, as well as practical considerations for working with galvanometer-based gauges. It would make a great weekend project for anyone seeking to add some vintage charm to their desktop rig. There’s also scope to monitor other variables, like hard drive usage or CPU temperature. There’s bonus points if you integrate this into a laptop; the tip line would love to know. We’ve seen LED-based monitoring systems before, too. Video after the break.

Continue reading “Analog Gauges Keep An Eye On Computer Performance”

Build Your Own Digital Panel Meter

A popular purchase from the usual stockists of imported electronic modules is a digital panel meter. A very small amount of money secures a module with a seven-segment display that you can stick on the front of your power supply or project for an easy readout. Even before the advent of these ultra-cheap Chinese products there have been readily available digital meters, in a line stretching back to the 1970s with chips such as the Intersil 7106.

[Marcus Taciuc] is eschewing the off-the-shelf parts, and creating his own digital panel meter. He’s using an MSP430 microprocessor as the brain of his device, and a Hitachi HD44780 compatible LCD display at the front end. The appropriate combinations of resistors and op-amps feeding the MSP’s ADC inputs allow his meter to be used to measure up to 40 VDV, and up to 10A.

He’s put up a video which we’ve included below the break, showing the use to which this meter has been put: replacing the moving-coil meter in what looks like a classic piece of Heathkit equipment. A 3D printed bracket allows the new meter to fit the circular hole of the original meter, with the LCD on the front. You might still order a prefab meter module, but you can’t deny this looks good.

Continue reading “Build Your Own Digital Panel Meter”

Panel Meter-To-Bluetooth Hack Hijacks The Display Segments

There are a proliferation of cheap digital meter modules available online for pocket money prices. Current, voltage, frequency, or combinations thereof can all be yours for just a few dollars and a wait for shipping. Unfortunately though these meters are all self-contained units. They do not have a serial port or other interface through which you can log their readings.

This failing was not an obstacle for [Scott Harden], though. He simply added a Bluetooth interface to his combined voltage and current meter module by using an ATmega328 microcontroller to capture the signals sent to the module’s display LEDs and interpret them into readings for his Bluetooth module. He details the process of reverse engineering the meter, and his build. The result is an intriguing mess of wires with a DIP ATmega hanging on their ends. But it performs the task requested of it admirably and when mounted in a project box you would not know what lurks within.

He has made his code for the project available in his GitHub repository, we can see that this could be a valuable technique for use with other similar displays. In the video below the break he gives us a full run-down, as if his comprehensive write-up was not enough.

Continue reading “Panel Meter-To-Bluetooth Hack Hijacks The Display Segments”

How To Weigh An Eyelash

So you’re a boxer, and you’re weighing in just 80 micrograms too much for your usual weight class. How many eyelashes do you need to pluck out to get back in the ring? Or maybe you’re following the newest diet fad, “microcooking”, and a recipe calls for 750 micrograms of sugar, and you need to know how many grains that is. You need a microgram scale.

OK, we can’t really come up with a good reason to weigh an eyelash, except to say that you did. Anyway, not one but two separate YouTube videos show you how to build a microgram balance out of the mechanism in a panel meter. You know, the kind with the swinging pointer that they used to use before digital?

Panel meters are essentially an electromagnet on a spring in the field of a permanent magnet (a galvanometer). When no current flows through the electromagnet, the spring pulls the needle far left. As you push current through the electromagnet, it is attracted to the fixed permanent magnet, fighting the spring, and tugs the pointer over to the right. More current equals more pull.

Continue reading “How To Weigh An Eyelash”

Monitoring The World’s DNS Status Using A Display Straight Out Of WarGames

Nothing says Cold War like a map of the work with LEDs embedded in it. Throw in some analog dials for good measure and you’ve got a piece that would be comfortable mounted next the WOPR in everyone’s favorite ’80s-computers-run-amok movie. We think [Dima] really hit the mark when building this status panel for OpenDNS datacenter monitoring.

[Dima] works for OpenDNS and wanted to make something special for its upcoming 5 year anniversary. He’d already been toying with making boxes from laser-cut wooden pieces. This was just a matter of choosing a size that would fit the dials and leave a suitable area for a laser-etched map. Each of the twelve panel meters gets a PWM signal from the Arduino Mega that he used to bring the device to life. It shows a comparative server load for each data center based on the previous day’s numbers. There is an LED in the map for each of these centers. Right now they’re all red, but he used RGB LEDs and plans to upgrade the capability soon. He should have no problem doing this as he sourced some TLC5940 drivers to extend his I/O capabilities.

Don’t forget the check out the clip embedded after the break. Continue reading “Monitoring The World’s DNS Status Using A Display Straight Out Of WarGames”