The oft-quoted saying “all models are wrong, but some are useful” is a tounge-in-cheek way of saying that at some level, tools we use to predict how the world behaves will differ from reality in some measurable way. This goes well beyond the statistics classroom it is most often quoted in, too, and is especially apparent to anyone who has used a GPS mapping device of any sort. While we might think that our technological age can save us from the approximations of maps and models, there are a number of limitations with this technology that appear in sometimes surprising ways. [Kyle] has an interesting writeup about how maps can be wrong yet still be incredibly useful especially in the modern GPS-enabled world. Continue reading “Misleading GPS, Philosophy Of Maps, And You”
Strava2 Articles
Busting GPS Exercise Data Out Of Its Garmin-controlled IoT Prison
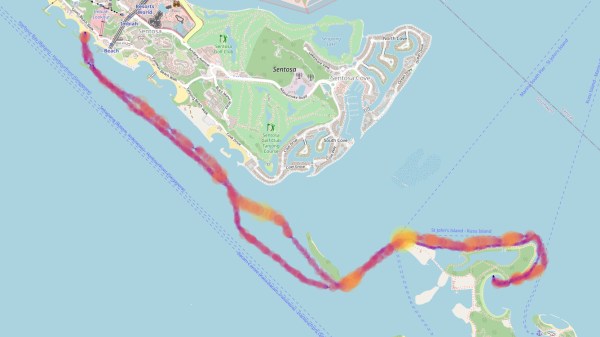
If you take to the outdoors for your exercise, rather than walking the Sisyphusian stair machine, it’s nice to grab some GPS-packed electronics to quantify your workout. [Bunnie Huang] enjoys paddling the outrigger canoe through the Singapore Strait and recently figured out how to unpack and visualize GPS data from his own Garmin watch.
By now you’ve likely heard that Garmin’s systems were down due to a ransomware attack last Thursday, July 23rd. On the one hand, it’s a minor inconvenience to not be able to see your workout visualized because of the system outage. On the other hand, the services have a lot of your personal data: dates, locations, and biometrics like heart rate. [Bunnie] looked around to see if he could unpack the data stored on his Garmin watch without pledging his privacy to computers in the sky.
Obviously this isn’t [Bunnie’s] first rodeo, but in the end you don’t need to be a 1337 haxor to pull this one off. An Open Source program called GPSBabel lets you convert proprietary data formats from a hundred or so different GPS receivers into .GPX files that are then easy to work with. From there he whipped up less than 200 lines of Python to plot the GPS data on a map and display it as a webpage. The key libraries at work here are Folium which provides the pretty browsable map data, and Matplotlib to plot the data.
These IoT devices are by all accounts amazing, listening for satellite pings to show us how far and how fast we’ve gone on web-based interfaces that are sharable, searchable, and any number of other good things ending in “able”. But the flip side is that you may not be the only person seeing the data. Two years ago Strava exposed military locations because of an opt-out policy for public data sharing of exercise trackers. Now Garmin says they don’t have any indications that data was stolen in the ransomware attack, but it’s not a stretch to think there was a potential there for such a data breach. It’s nice to see there are Open Source options for those who want access to exercise analytics and visualizations without being required to first hand over the data.


