Previously, we discussed how to apply the most basic hypothesis test: the z-test. It requires a relatively large sample size, and might be appreciated less by hackers searching for truth on a tight budget of time and money.
As an alternative, we briefly mentioned the t-test. The basic procedure still applies: form hypotheses, sample data, check your assumptions, and perform the test. This time though, we’ll run the test with real data from IoT sensors, and programmatically rather than by hand.
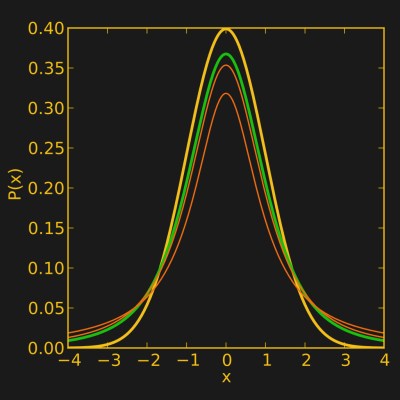
The most important difference between the z-test and the t-test is that the t-test uses a different probability distribution. It is called the ‘t-distribution’, and is similar in principle to the normal distribution used by the z-test, but was developed by studying the properties of small sample sizes. The precise shape of the distribution depends on your sample size.
In our previous example, we only dealt with the situation where we want to compare a sample with a constant value – whether a batch of resistors were the value they were supposed to be. In fact there are three common situations:
- You want to compare a sample to a fixed value: One sample t-test
- You want to compare two independent samples: Two sample t-test
- You have two measurements taken from each sample (e.g. treatment and control) and are interested in the difference: Paired t-test
The difference mainly affects how you might set up your experiment, although if you have two independent samples, there is some extra work involved if you have different sample sizes or one sample varies more than the other. In those cases you’re probably better off using a slight variation on the t-test called Welsh’s t-test.
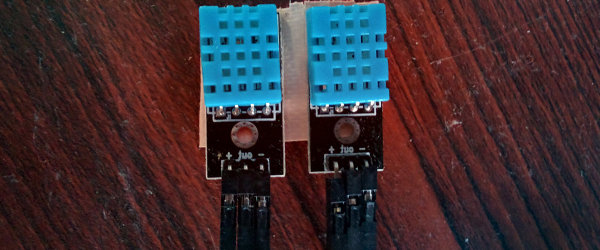
In our case, we are comparing the temperature and humidity readings of two different sensors over time, so we can pair our data as long as the sensors are read at more or less the same time. Our null and alternate hypotheses are straightforward here: the sensors either don’t produce significantly different results, or they do.
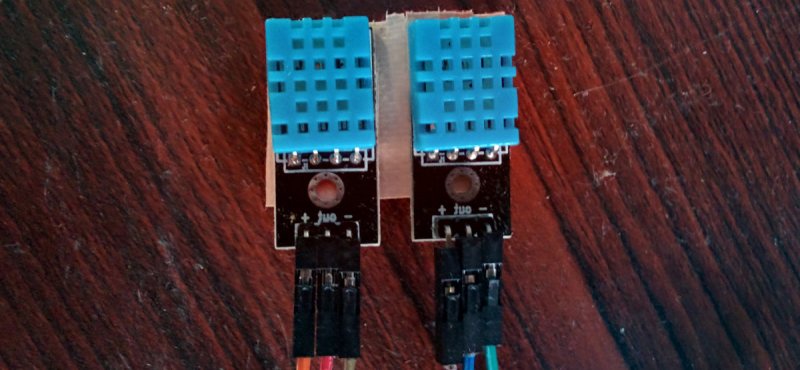
Next, we can sample. The readings from both sensors were taken at essentially the same time every 10 seconds, and sent via MQTT to a Thingsboard server. After a couple of days, the average temperature recorded by each sensor over 10 minute periods was retrieved. The sensor doesn’t have great resolution (1 °C), so averaging the data out like this made it less granular. The way to do this is sort of neat in ThingsBoard.
First you set up an access token:
$curl -X POST --header 'Content-Type: application/json' --header 'Accept: application/json' -d '{"username":"yourusername", "password":"yourpassword"}' 'http://host.com:port/api/auth/login'
Then you request all data for a particular variable, averaged out every 10 minutes in JSON format (timestamps will be included):
$curl -v -X GET "http://host.com:port/api/plugins/telemetry/DEVICE/devicekey/values/timeseries?keys=variablename&startTs=1510917862000&endTs=1510983920000&interval=600000&limit=10000&agg=AVG" \
--header "Content-Type:application/json" \
--header "X-Authorization:Bearer (token goes here)" > result.txt
What’s cool about using an API like this is that you can easily automate data management and testing as parts of a decision engine. If you’re using less accurate sensors, or are just measuring something that varies a lot, using statistical significance as the basis to make a decision instead of a single sensor value can really improve reliability. But I digress, back to our data!
Next, I did a little data management: the JSON was converted to a CSV format, and the column titles removed (timestamp and temperature). That made it easier for me to process in Python. The t-test assumes normally distributed data just like the z-test does, so I loaded the data from the CSV file into a list and ran the test:
import scipy.stats as stats
import csv
import math as math
import numpy as numpy
#Set up lists
tempsensor1=[]
tempsensor2=[]
#Import data from a file in the same folder
with open('temperature1.csv', 'rb') as csvfile:
datareader = csv.reader(csvfile, delimiter=',', quotechar='|')
for row in datareader:
tempsensor1.append(float(row[1]))
with open('temperature2.csv', 'rb') as csvfile:
datareader = csv.reader(csvfile, delimiter=',', quotechar='|')
for row in datareader:
tempsensor2.append(float(row[1]))
#Subtract one list from the other
difference=[(i -j) for i, j in zip(tempsensor1, tempsensor2)]
#Test for normality and output result
normality = stats.normaltest(difference)
print "Temperature difference normality test"
print normality
In this case the normality test came back p>0.05, so we’ll consider the data normal for the purposes of our t-test. We then run our t-test on the data with the below. Note that the test is labeled ‘ttest_1samp’ in the statistics package – this is because running a 1-sample t-test on the difference between two datasets is equivalent to running a paired t-test on two datasets. We had already subtracted one list of data from the other for the normality test above, and now we’re checking if the result is significantly different from zero.
ttest = stats.ttest_1samp(difference, 0, axis=0)
mean=numpy.mean(difference)
print "Temperature difference t-test"
print ttest
print mean
The test returns a t-test statistic of -8.42, and a p-value of 1.53×10⁻¹³, which is much less than our threshold of p=0.05. The average difference was -0.364 °C. What that means is that the two sensors are producing significantly different results, and we have a ballpark figure for what the difference should be at a temperature of around 30 °C. Extrapolating that result to very different temperatures is not valid, since our data only covered a small range (29-32 °C).
I also ran the above test on humidity data, but the results aren’t interesting because according to the datasheet (PDF warning), the relative humidity calculation depends on the temperature, and we already know the two devices are measuring significantly different temperatures. One interesting point was that the data was not normally distributed – so what to do?
A commonly used technique is just to logarithmically transform the data without further consideration and see if that makes it normally distributed. A logarithmic transformation has the effect of bringing outlying values towards the average:
difference=[(math.log1p(i) - math.log1p(j)) for i, j in zip(humidity1, humidity2)]
normality = stats.normaltest(difference)
print "Humidity difference (log-transformed) normality test"
print normality
In our case, this did in fact make the data sufficiently normally distributed to run a test. However, it’s not a very rigorous approach for two reasons. First, it complicates exactly what you are comparing (what is the meaningful result if I compare the logarithm of temperature values?). Secondly, it’s easy to just throw various transformations at data to cover up the fundamental fact that your data is simply not appropriate for the test you’re trying to run. For more details, this paper points out some of the problems that can arise.
A more rigorous approach that is increasing in popularity (just my opinion on both counts), is the use of non-parametric tests. These tests don’t assume a particular data distribution. A non-parametric equivalent to the paired t-test is the Wilcoxon signed-rank test (for unpaired data use the Wilcoxon rank-sum test). It has less statistical power than a paired t-test, and it discards any datum where the difference between pairs is zero, so there can be significant data loss when dealing with very granular data. You also need more samples to run it: twenty is a reasonable minimum. In any case, our data was sufficient, and running the test in Python was simple:
import scipy.stats as stats
list1=[data__list_goes_here]
list2=[data__list_goes_here]
difference=[(i -j) for i, j in zip(list1, list2)]
result=stats.wilcoxon(difference, y=None, zero_method='wilcox', correction=False)
print result
When we ran it, the measured humidity difference was significant, with an average difference of 4.19%.
You might ask what the practical value of all this work is. This may just have been test data, but imagine I had two of these sensors, one outside my house and one inside. To save on air conditioning, a window fan turns on every time the temperature outside is cooler than the temperature inside. If I assumed the two devices were exactly the same, then my system would sometimes measure a temperature difference when there is none. By characterizing the difference between my two sensors, I can reduce the number of times the system makes the wrong decision, in short making my smart devices smarter without using more expensive parts.
As a side note, it has been overstated that it’s easy to lie with statistics. To borrow an idea from Andrejs Dunkels, the real issue is that it’s hard to tell the truth without them.


I kinda wonder why the T distribution curves don’t follow the ones for dice (a pyramid at 1 DoF, closer to a normal as more dice added to the sum). I guess the assumption is that the populations are at least a little normal even with no summation?
Speaking of which is there another distribution for that kind of thing (sums of numbers evenly spread across a fixed range)?
“Uniform”.
I think Steven is talking about the sum of uniforms: https://en.wikipedia.org/wiki/Irwin%E2%80%93Hall_distribution
“there can be significant data loss when dealing with very granular data” A personal beef. Whats does granular mean here? I know it is commonly used among programmers and there is assumed to be an agreed understanding, but I doubt if there is universal understanding.
To be more granular means to have finer grains, does it not? To be grain-like as opposed to big chunks or solid blocks or slabs. The surface of Mars is granular. Fine, course, and high or low resolution are a lot better for us old picky types.
Ambiguous!
Very granular is on the digital end of the continuous-vs-discrete scale, opposite to smooth or analog.
Clay is less granular than sand, despite the fact that clay particles are finer than sand.
But I’m in the abrasives industry, so I’m doubly biased.
The particular sensor I used reported temperature to the nearest degree, so the value wasn’t really a continuous variable.
A ten-minute average of 600 values creates a reasonable approximation of a continuous variable.
Could have included this, but didn’t for brevity. My goal wasn’t to make a standard test for sensor variance but just to point out that the data backend supports data averaging, and that’s very convenient.
According to the data sheet, it reports TWO bytes. One for degrees, and the second for fractions of a degree. The would be 1/256 degree…which, of course, I don’t believe.
This is a poorly spec’d part.
I’m disappointed that humidity data wasn’t analyzed… Isn’t that why you use a DHT11 sensor instead of a cheaper temperature sensor? If the data is meaningless because the two temperature sensors don’t agree, then what’s the point of having a DHT11?
There was mention of the fact that “relative humidity” is based on temperature. RH is a calculation that uses absolute humidity (water vapor content of the air, typically in grains per cubic meter) and temperature to determine what percentage of water the air is holding vs. the maximum it can hold at a given temperature, basically “how saturated is it?”.
If that sensor happened to make absolute humidity readings directly available then one could analyze “humidity” data without concern for the temperature error.
Remember Minority Report? Sensors are like that. They’re not really wrong — but sometimes they disagree.
I did analyze the humidity data as it turns out, I just spoke about it briefly. It’s just as [a_do_z] points out though, relative humidity is calculated based on the given temperature. So the fact that the observed temperature is significantly different means that the measured humidity is very likely to be different too — so the test wasn’t so interesting as the result is not independent of the first test.
I did run it though and there was an average difference of about 4% between the two sensors. The datasheet says that the sensors are only accurate to 5% so this isn’t abnormal.
It might be fun to take a few DHT-11s and see if the average is more accurate than a more expensive sensor (I doubt it but it could happen!).
If your looking for fradulent devices, comparing one to another is not going to help. You need to sample several from a group, or more than three. In most cases of part substitution, the devices will work at room temperatures, but you have to test at either the highest or lowest settings to find the component that won’t work at the rated condition. In all cases of part substitution, the component with the expected rating is swapped with a component with less of a rating, so only testing at the extreme range of the wanted sensors ratings will uncover the fradulent part.
I don’t think the point is that they are fraudulent. These are probably legit, even the 100% legit DHT11’s just suck that much. Even their slightly nicer sibling the DHT22 has really bad problems with consistency and stability. I dunno why people still use them when there are better, easier to use and cheaper sensors… e.g. the Si7021 is superior in every way and can be had for $2 off of Aliexpress.
I know why. It’s familiarity and positive feedback.
One person writes an Arduino lib to read a part, and tons of other people follow suit because it’s the path of least resistance. After a while, every temperature project on the Internet uses the DHT11/22, and then it’s even more cemented in. In analog design, you still see people using very old op-amps or transistors for the same reason.
Write up a project or whatever with the Si7021, especially if you can show how it’s better than the DHTs, let us know at tips@hackaday.com, and we’ll work on the problem.
Playing with SI7021 from ebay i can say that they are not that accurate either. At least not over time. I have one that never goes below 60% humidity, one that is always about 20% more than another, and one that seems to like large jumps in reading. They seem pretty ok on the temperature side, but i would not be surprised if the sensors sold outside official channels are factory rejects.
While I wasn’t trying to detect a fraudulent part, that’s a really good idea!
Multiple comparisons become an issue, but with the sheer amount of data that can be collected I think it would be possible to make a web-connected automated parts tester. Just a bunch of sockets that test ‘something’ like an IC timing or current draw every few seconds, and push the data to the cloud. After a day or so you have quite a bit of data, probably enough to know with a fair level of certainty whether your parts are within tolerances for your application.
Actually, I’m going to go do this now. I need to manufacture a bunch of ‘cantenna’ waveguides from brass/copper pipe and an automated test system to make sure RSSI and directionality are within tolerances will save me a lot of time. They’re meant to be used with the ESP8266 and a standard router anyway, so this could be a very effective way to use the methods described in the article.
This is a really shitty part.
I just learned a life lesson.
DON’T USE DHT-11/DHT-22 for humidity measure.
DON’T USE DHT-11/DHT-22 for humidity measure.
DON’T USE DHT-11/DHT-22 for humidity measure.
at all costs, if you are working on any projects that do something useful. These sensors are completely junks for measuring humidity.
Humidity measurement is one of the difficult practical problem in basic meteorology, it’s okay to have a relatively large margin of error, but falsely claim in the datasheet that you are able to do it in a reasonable accuracy is not acceptable.
I thought DHT-22 was better, but it turned out to be a mistake, it can’t be used even as a basic reliable humidistat which I was working on. These sensors also have a high failure rate.
I strongly recommended this excellent experiment report of 8-way humidity sensor comparison by Robert, if you are interested, or looking for an alternative: http://www.kandrsmith.org/RJS/Misc/Hygrometers/calib_many.html
TL;DR: BME280, HTU21D and Si7021, or SHT71 if you have a greater budget.