In a previous post, I showed how you could upload images into a Discord server from Python; leveraging the popular chat platform to simplify things like remote monitoring and push notifications on mobile devices. As an example, I showed an automatically generated image containing the statistics for my Battlefield 1 platoon which gets pushed to member’s devices on a weekly basis.

The generation of that image was outside the scope of the original post, but I think it’s a technique worth discussing on its own. After all, they say that a picture is worth 1000 words. So that means a picture that actually contains words must be worth way more. Like, at least 2000, easy.
Being able to create images from your textual data can lend a bit of flair to your projects without the need to create an entire graphical user interface. By putting a text overlay on a pre-rendered image, you can pull off some very slick visuals with a minimum amount of system resources. So long as you have a way of displaying an image file, you’re good to go.
In this post I’ll quickly demonstrate how to load an image, overlay it with text, and then save the resulting image to a new file. This technique is ideal in situations where a display doesn’t need to be updated in real-time; visuals can be generated at regular intervals and simply displayed as static images. Possible uses include weather displays, “magic” mirrors, public signage, etc.
Python Imaging Library
To manipulate images in Python, you need the aptly named Python Imaging Library (PIL). Unfortunately, PIL development seems to have stopped sometime in 2009 and while it technically still works, it doesn’t support Python 3.x. A fork of PIL exists, called Pillow, which is actively maintained and fixes some of the issues with PIL. If for nothing else, you should use Pillow just to future-proof your code.
As with most Python libraries, it can be installed with pip:
External Resources

For this technique we’ll be loading two external resources: a TrueType font for our text, and a background image to overlay. Between these two elements you have the opportunity to put together a very visually appealing final product with minimal effort and code. If you plan ahead, you can add tables or other visual delimiters to the background image, and of course there’s a whole universe of awesome fonts out there.
As a friendly reminder, make sure the licenses for any fonts or background images you include in your project are properly adhered to. If you’re just working on a project for yourself you can do whatever you wish, but once you put it up on GitHub or otherwise start distributing it, things can get tricky. I’ve found that most fonts posted online tend to have pretty permissive licenses for non-commercial use, but you should always double check. Even if non-commercial use is allowed, the terms of the license will usually ask for proper credit in your software’s documentation. The licenses for graphics can be a bit more restrictive, so I’d recommend looking at the repositories of public domain images to make life easier.
Example Code
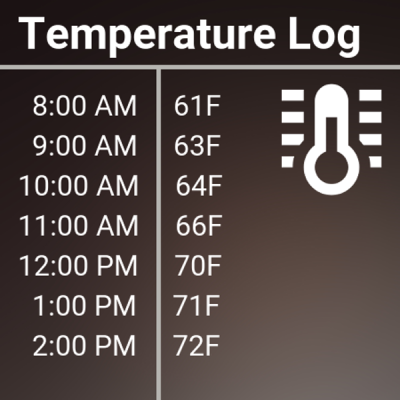
Let’s say you had a temperature sensor that was recording hourly data, and you wanted a way to show that with a bit more flair than a CSV file. We’re going to cheat a bit here and say that the list “temps” has already been populated with a few time and temperature combinations, but the rest of the code is completely valid.
#!/usr/bin/env python

from PIL import Image, ImageDraw, ImageFont

# Text positioning
text_y = 100
text_pad = 45

# Define fonts for regular text and heading
data_font = ImageFont.truetype('Roboto-Regular.ttf', 32)
header_font = ImageFont.truetype('Roboto-Bold.ttf', 50)

# Load background image
bg_img = Image.open('bg_img.png')
surface = ImageDraw.Draw(bg_img)

# Write heading
surface.text((20, 8), 'Temperature Log', font=header_font)

# Write temperatures
for x in range(len(temps)):
    surface.text((20, (text_y + (text_pad * x))), temps[x], font=data_font)

# Save file
bg_img.save(open('temp_log.png', 'wb'), 'PNG')
The resulting image, saved to temp_log.png, can be seen at the right.
 Briefly running down the code: it defines two different sized fonts, loads the background image, creates a surface we can manipulate, and then prints the text at the X and Y coordinates specified. The loop goes through the list of temperatures, printing each one a bit lower down the image. The final line saves our work to a new file. It’s worth noting that the original image is not modified in any way, so you can run this script over and over with new data and you’ll have a updated image at whatever frequency works for your project.
Of course this is a very simplistic example, but gives a good idea of how a static background image combined with dynamic data to create a visually appealing final image.
Incidentally, the font used here is from Google’s Roboto family, and the icon comes from the “Material Design Icons” project. Both excellent resources if you’re looking for attractive fonts and iconography under a free and open source license.
Final Thoughts
This article should give you an idea of the kinds of things you can do with just a few lines of Python, but it’s by no means an exhaustive look at the subject. The next step from here would be utilizing colors, opacity, and graphics primitives to create even more robust imagery, such as the system monitor display at the top of this article. With code like this and a network-enabled picture frame (perhaps of the DIY variety powered by the Raspberry Pi), you’re well on your way to creating a slick monitoring system for anything you might want to keep an eye on.


Pretty slick! Beats running ImageMagick through the command line… or does it?
A quick search for ‘ImageMagick Python library’ turned up Wand: http://docs.wand-py.org
Thanks for sharing, I tend to lean on SVG for similar purposes as it’s even more straight forward than this. But not always the right tool for the job. Thanks again!
” With code like this and a network-enabled picture frame (perhaps of the DIY variety powered by the Raspberry Pi), you’re well on your way to creating a slick monitoring system for anything you might want to keep an eye on.”
A living calendar. An interactive TV Guide.
Python is just so great for visualizations; with matplotlib, you could probably get some pretty advanced auto-generated dashboard images without much effort.
http://jupyter.org/
ImageMagick can be used with Python, and it is awesome
Actually, these are pretty pictures with lots if text in them…
I like to use pycairo for such things. It has user friendly API, good support for images, fonts and some vector graphics, and you can output everything to screen (for example with GTK), image file or pdf. There is also WeasyPrint library built on top of pycairo which allows HTML with decent CSS support rendering.
can it do graphs and export them to an img?
You can do graphic primitives like lines and squares, so basic graphs could be scripted up if you wanted.
FYI: the sample code is missing the array of time/temps and only includes code for drawing temps.
temps = [“63″,”65″,”67″,”70”]
times = [“6am”,”7am”,”9:30am”,”11am”]
# Write temperatures
for x in range(len(temps)):
surface.text((20, (text_y + (text_pad * x))), temps[x], font=data_font)
# Write time
for x in range(len(times)):
surface.text((120, (text_y + (text_pad * x))), times[x], font=data_font)
should get one a lot closer to a running example.
thank you for your reply Jack
895 days? holy shit dude.
I don’t see the value of this post. It just a simple Python script that shows an image and some text. Pretty boring.
The value is for those of us who don’t live the Python world, or who are new to this — it demonstrates a composition technique that is simple and attractive. I think that’s value.
But if you disagree, you’re free to create topics of your own with more “value.”