
You finally finish writing the Verilog for that amazing new DSP function that will revolutionize human society and make you rich. Does it work? Your first instinct, of course, is to blow it into your FPGA of choice and see if it works. If it does, that was a great idea. If it doesn’t, it was a terrible idea because — typically — it is hard to look inside the FPGA. That’s why you’ll typical simulate your logic on a desktop computer before you commit it to the FPGA. But that means you have to delay gratification long enough to write a testbench — a piece of hardware description language (HDL) code that exercises the function you wrote. In this post I’ll show you a small piece of software that can read your Verilog module and automatically create most of a testbench for you. The code originally came from GitHub, but I wanted to make some changes to it, so I forked it and I’ll tell you about the changes I made. This isn’t specific to a particular FPGA. Any Verilog project can use the tool to generate a simple starter testbench.
Writing a testbench isn’t that hard. You usually use the same language you wrote the original code in but since it won’t reside in silicon, you can do things in the simulator that you can’t get away with in code that you’ll synthesize. However, it is a bit painful to have to always write more or less the same code, especially if you have a lot of modules you want to test. But it is a good idea to test small modules before linking them together and then test them linked together, too. With this little Python script, it is very easy to generate a simple testbench and then further elaborate it. It isn’t life-changing, but it does save some time. If you want to try this out, you’ll need something to run the Python script on, of course. You also need a Verilog simulator or you can use EDA Playground to try all this out in your browser.
Anatomy of a Testbench
A Verilog testbench usually had a few major sections:
- A module with no inputs or outputs. This is like the main function of a C program.
- Reg variables for all the inputs you want to feed to the device or devices under test.
- Wire variables for all the outputs you want to monitor for the device or devices under test.
- An initial section that initializes all the reg variables.
- Since the device under test probably needs a clock, an always block or a forever loop will create the clock in one of the reg variables.
- Since the device under test probably needs a reset, you’ll frequently start out by generating a reset.
- You’ll want to send some special commands to the Verilog simulator to ask it to monitor certain signals and record them to a file. You can also just print things like a pass/fail message, but usually you want a file with the signal tracing.
- You’ll then send the device under test whatever input vectors you want placing an appropriate time delay between signal transitions.
There are two features of the Verilog simulator that make this work. First, you have a timescale statement at the start of the testbench that tells the simulator what each “tick” represents and how precise the tick is. For example, you might have `timescale 1ns/100ps which means that a delay of 1 means 1 nanosecond with sufficient resolution for 1.1 and 1.2 nanosecond delays. Contrast that to `timescale 1ns/1ns which only has 1 ns resolution. If you wrote 1, 1.1, and 1.2 nanosecond delays, they would be rounded to be the same 1 ns delay. Of course, delays aren’t something you can use in code that targets the FPGA, but in the simulation, they are fair game.
So, for example, if you wanted to assert a signal for 5 nanoseconds (given the above timescale) you might write:
reg thesignal=0;

...

thesignal=1'b1;

#5 thesignal=1'b0;
An Example Testbench
Armed with all this, let’s jump into a simple test bench. The device under test doesn’t matter, although it is the example on GitHub, if you are curious. I’m going to break it up into pieces:
`timescale 1ns/1ns //Adjust to suit

module tb_top;
This is the timescale and the module with no I/O. The next section covers the input and output variables for the device under test.
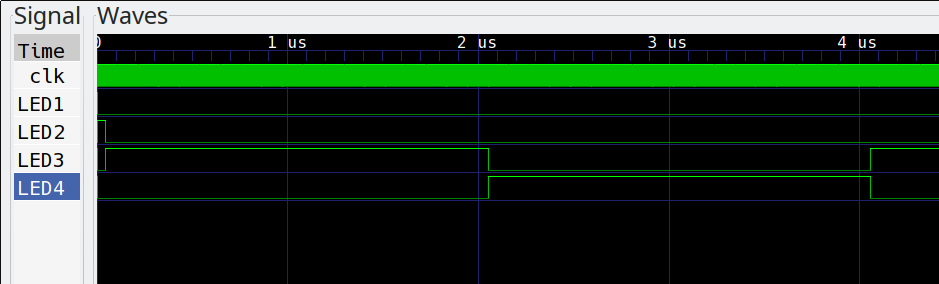
reg clk ;
reg rst ;
reg run ;
reg hold ;
wire LED1 ;
wire LED2 ;
wire LED3 ;
wire LED4 ;
Here’s where you create the module you want to test. UUT stands for Unit Under Test.
top uut (
.clk ( clk ),
.rst ( rst ),
.run ( run ),
.hold ( hold ),
.LED1 ( LED1 ),
.LED2 ( LED2 ),
.LED3 ( LED3 ),
.LED4 ( LED4 )
);
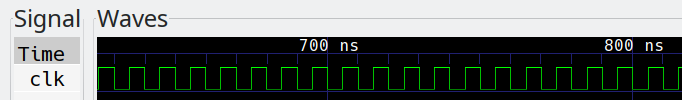
The period of the clock will be 10 nanoseconds.
parameter PERIOD = 10; //adjust for your timescale
This section of code will set the output file, set what we want to look at, and generate the clock. The $dumpvars statement tells the simulator to start at tb_top (this module) and do as far as the next layer in the hierarchy.
initial begin
   $dumpfile("tb_output.vcd");
   $dumpvars(2, tb_top);
   clk = 1'b0;
   #(PERIOD/2);
   forever
    #(PERIOD/2) clk = ~clk;
end
I usually use an always block to generate the clock, but a forever loop like this works too. You just can’t put anything after it except the end since the loop never exits. But as you can see below, it works fine.
This little snippet handles the reset signal. Note that the reset signal is negative you only have to change the first zero.
initial begin
   rst=1'b0;
   #(PERIOD*2) rst=~rst;
   #PERIOD rst=~rst;
end
Finally, we initialize the device inputs, wait a bit for the reset to settle, and then give it some test inputs. After waiting a bit, we call $finish to stop the whole thing.
initial begin
   run=1'b0;
   hold=1'b0;
   #(PERIOD*10) run=1'b1;
   #PERIOD run=1'b0;
   #(PERIOD*1024) hold=1'b1;
   #PERIOD hold=1'b0;
   #(PERIOD*100)
   $finish;
end

endmodule
Automation
The original Python program I found on GitHub did most of this. However, a lot of things were hardcoded and although it detected the reset signal, it didn’t do anything with it. What’s more, it not only didn’t exercise reset, but it also didn’t do any of the test signals for you, which is understandable. However, if you made a change to the file and then wanted to regenerate the test bench (perhaps your module changed its inputs and outputs) you’d lose your changes!
I forked the code and changed it to run with Python 3, added command line options to it, and then made some changes to pulse reset. To handle your addition, the testbench includes a file that you can use to write your own test code. That way regenerating the test bench won’t clobber your code.
These are all simple changes, but they pay off. If you use no options, you get sensible defaults. However, you can specify any or all of the following:
- -d – Set custom dumpfile name
- -i – Set custom user include file
- -l – Set dumpvars level
- -p – Set period
- -r – Make reset active low
- -t – Set timescale
So in the above example, the final initial block would wind up in the user include file since the script didn’t generate it. All the rest of it was the automatic output from the tool.
Try It
There’s an example module, top.v, included in my fork of the project. Actually, you may have seen this before in the post about embedding logic analyzers, but for now, I reduced the timing delays to make it easier to simulate. This isn’t uncommon since a one-second delay at 12 MHz takes 12 million clock cycles.
The defaults for this are just fine so issue a command like:
./tbgen.py top.v tb_top.v
Of course, you don’t need the ./ if the executable is on your path. Now you need to simulate the tb_top.v file. I’ve already provided the user include (user.tb_top.v), but if you were starting from scratch you’d have to create that file even if it were empty. This is the file that holds your specific tests to carry out.
If you use Icarus, your simulation might look like this:
iverilog tb_top.v top.v -o tb_top
vvp tb_top
gtkwave tb_output.vcd
If you don’t want to install anything, you can try EDA Playground. Just put the testbench file in the left-hand pane and the top module in the right-hand pane. You’ll need to either paste the user include file in over the include statement or create a new test bench tab and put it there. I’ve already done that for you, if you want a peek.
What’s it Worth?
Like most tools, this works best if you know how to not use the tool. Despite being handy, you still need to understand a few things about testbenches to make it work. On the other hand, it is a nice timesaver to not have to create the same code over and over for multiple modules. It also makes your test code a bit more consistent. If you don’t like the generated code, it is pretty easy to make changes even if you aren’t a Python wizard. I thought about changing the code to work from a template file, but it was fine like it is. However, not being one to leave well enough alone, I have a version that reads from a template file in the template branch on GitHub if you want to try it.
You might argue that you don’t want to simulate your Verilog and, instead, you’d rather put a logic analyzer on board and debug on the actual hardware. That sounds great in theory and I’ll actually show you how to do that in a future post. But there are problems. You generally can’t get everything in a logic analyzer unless your design is very simple. Reconfiguration can be a long process and you don’t always have the ability to set up the exact stimulus you need. Simulation is sort of a “God Mode” where you can make anything happen and see everything. Of course, simulation has its own problems, especially behavioral simulation where you aren’t accounting for real timing delays and things like that. So I’d argue that while onboard logic analyzers are a great tool, it isn’t a replacement for simulation just as simulation can’t completely replace live debugging.
Meanwhile, using this tool can help you create your testbenches. Reading its generated code can help you learn how to create your own even if you don’t want to use the tool in every case.


Cool beans, thanks for the timesaver.
Also highly recommended: https://www.veripool.org/wiki/verilator
Very fast, and allows easy integration with C/C++ code.
Very unfortunate that it doesn’t support SystemVerilog, or else it would be in the running for the best free tool around! Vivado is very sleek but doesn’t really support SV either, arguably the best in terms of features is ModelSim even if code coverage is licence locked…..
https://stackoverflow.com/questions/1633559/experiences-with-test-driven-development-tdd-for-logic-chip-design-in-verilo
Or if you’re a VHDL purist, there’s Emacs VHDL Mode, Or Aldec ActiveHDL & other professional tools… Xilinx ISE, etc. Can save days of working at the top level sim of one or more 1728-pin devices.
Great post, I used to dabble with GALs decades ago, new project will need investigation into FPGAs so most timeline to get heads up, thanks :-)
I usually use autoinst, autowire and autoreginput i verilog-mode in emacs to get about the same functionality. (In systemverilog autoinput is not really required since you can use .* instead, and autowire can be autologic.)
If you don’t use emacs you can still call emacs in batchmode to use these features. (They really simplify your design.)
I typically use Vivado for Verilog simulation. I keep the legacy ISE software around for both older parts and the fact that I can take a Vivado Verilog source file into ISE and it will create the testbench framework very similar to what you describe. Your code looks like a nice alternative and gives me an opportunity to learn more Python. Thanks!
I’d also like to recommend Blaine Readler’s ‘Verilog by Example’. It’s about $20, well written and only about a hundred pages. Google it.
Thanks again!