If you’ve ever dreamed of building a proper spectrometer, it looks like the ESPROS epc901 CCD sensor is absolutely worth your attention. It’s fast, sensitive, easy to interface with, and at just $24 USD, it won’t break the bank. There’s only one problem: implementing it in your project means either working with the bare 2×16 0.5 mm pitch BGA device, or shelling out nearly $1,400 USD for the development kit.
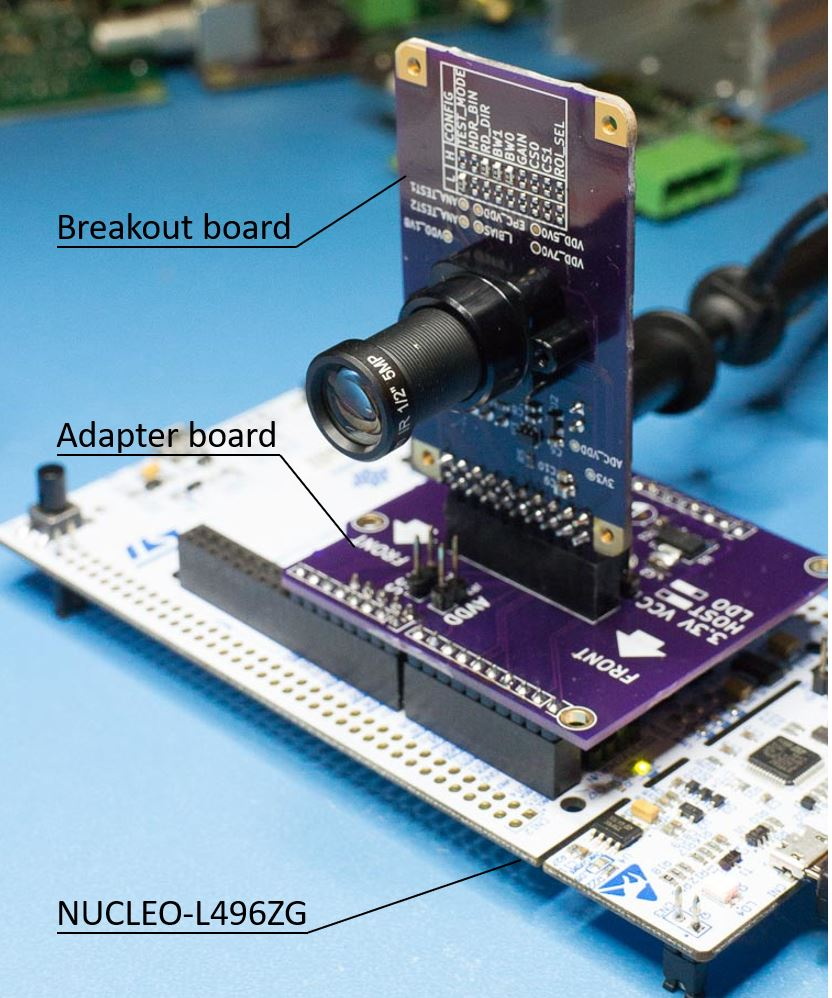 Thankfully, [Adrian Studer] has come up with a compromise. While you’ll still need to reflow the BGA to get it mounted, his open hardware breakout and adapter boards for the ESPROS epc901 make the sensor far easier to work with.
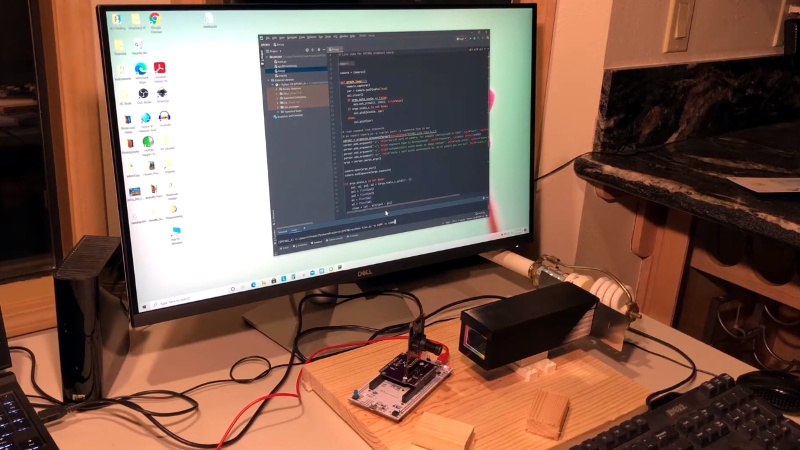
It’s not just a hardware solution either, he also provides firmware code for the STM32L4 based Nucleo development board and some Python scripts that make it easy to pull data from the sensor. The firmware even includes a simple command line interface to control the hardware that you can access over serial.
With the sensor successfully wrangled, [Adrian] partnered with [Frank Milburn] to build an affordable spectrometer around it. The design makes use of a 3D printed chamber, a simple commercial diffraction grating, and an array of entrance slits ranging from 0.5 to 0.0254 millimeters in width that were laser-cut into a sheet of stainless steel.
In the videos after the break, you can see the finished spectrometer being used to determine the wavelength of LEDs, as well as a demonstration of how the high-speed camera module is able to study the spectral variations of a CFL bulb over time. [Adrian] tells us that he and [Frank] are open to suggestions as to what they should point their new spectrometer at next, so let them know in the comments if you’ve got any interesting ideas.
We’ve seen an incredible number of spectrometer builds over the years, and some of the more recent ones are really pushing the envelope in terms of what the DIY scientist is capable of doing in the home lab. While they’re still fairly niche, these instruments are slowly but surely finding their way into the hands of more curious hackers.


très cool!
Something like this has been on my TechnoBuckList for ever. I’m a little intimidated by BGA. especially at 24 bucks a try – could get expensive fast… But, hey, you can’t take it with you.
On the LiteOn spectrum graph, I’ve always believed that those graphs don’t come from actual measurements. I mean real measurements have noise in them. My guess is there is a person in their tech writing group that slaps a clip-art normal distribution curve on and ships the doc out. It looks like the peak is at 575 nm while the document says is it almost 600.
On the calibration side, is the sensor sensitivity based on wavelength factored in? I guess I could go read code…
Re clean spectrum graphs in datasheets: They may simply average multiple measurements to get the nice smooth graphs. Our software doesn’t do any averaging.
Re sensitivity over wavelength: We don’t compensate for that yet as we don’t have any means to measure absolute intensity. There’s a very basic graph in the datasheet of the epc901, so we could create a curve by eyeballing it.
Yeah, eye-balling a datasheet graph isn’t very satisfying though may be better than nothing.
Interesting problem to calibrate. need a good reference. Is the sun’s spectrum very consistent? I suppose it would depend on atmospheric conditions, angle (ie time of day), …
Use an incandescent lamp. If you know the temperature or the peak, you can calculate intensity versus wavelength. It is a good start anyway. (Sunlight has too many absorption and emission lines)
for calibration, DPSS lasers would be an option…532nm for the typical doubled Nd:YAG, 1064nm without the doubling (if the sensor has any sensitivity at such wavelengths)
pump diode should run at 808nm, but it’s probably nowhere near as precise as the crystals…
Lasers are good for calibrating the x axis (wavelength), but not for calibrating absolute amplitude or compensating for sensor sensitivity varying with wavelength. For that you need a known reference spectrum – usually, a calibrated incandescent source (constant current driver for maximum stability) is typical.
Adrian : You can do intensity calibration using a regular quartz tungsten halogen lamp scattered off a white surface (ideally Teflon) and calculating of filament temperature from its resistance, the results are within a few percent of a real calibration using a NIST-traceable reference lamp.
See this article for details : https://eprints.lancs.ac.uk/id/eprint/6736/1/inproc_326.pdf
Thanks for this!
I’ve been considering building a setup similar to the efforts Glenn Butcher has been working on at https://discuss.pixls.us/t/the-quest-for-good-color-1-spectral-sensitivity-functions-ssfs-and-camera-profiles/18002 (and 3 additional posts) for measuring CMOS sensor SSFs – a good reference spectrum has been one of the challenges there.
In addition to my other comment:
Am I correct in assuming that determination of actual temperature was done as follows:
Determine effective filament length from “ambient temperature” resistance (probably not even strictly necessary to calculate the effective length, since it all comes out to a ratio)
Based on measured resistance at ambient, and measured operational resistance, back-calculate temperature from the resistivity vs. temperature tables in Appendix 2?
That’s correct. The ratio of resistivities is the same as the ratio of resistances if you neglect filament thermal expansion (which is a reasonable approximation to make). See equation (8) in the paper I posted. Then from that calculated temperature, and using known published values for spectral emissivity of tungsten, you can easily calculate the expected blackbody emission using equation (1).
The tables in appendix 2 don’t have a lot of datapoints, but you can interpolate.
I should add that it’s not enough to use the CCD’s responsivity curve alone, because the grating’s diffraction efficiency also depends on wavelength (a lot! sometimes by a factor of 2 or more between blue and red depending on the grating’s quality). Any intensity calibration needs to compensate for the response of the whole system (order-sorting filters + focusing optics + grating + sensor) to be valid.
Also, you can use a $0.50 neon indicator lamp as a good spectral line source to calibrate the wavelength, with narrower and more stable peaks than the emission from a CFL. You can easily find the official reference values for the emission lines of neon on NIST’s website.
Thank you for the tips about calibration. Very helpful!
Luckily, I am a chemist by trade and my lab has certified Metal on quartz ND filters, mercury lamp, and holmium stds. These are the best options for intensity and wavelength calibration. Thorlabs has some inexpensive I mounted ND filters. You could also try to use a xenon flash flight to try and calibrate wavelengths. Most xenon lamps are pretty bright so you might have to use a very small slit width. You’ll get better resolution like that anyway.
I really like this. It’s effective and useful for gathering data.
I have a small project on the back burner for my kids when they get a little older involving a Rpi camera module and a slit aperture+diffraction film so they can see the way different things give off different spectrums if light. Nowhere near as nice as this guys project though, but I don’t have the time to learn BGA reflow!
The difficulty in building an inexpensive high quality spectrometer is not at all the detector. Any decent camera will work pretty well.
The hard part is getting decent optics at a reasonable price. That diffraction grating used in this project is wonderfully cheap, but it’s very inefficient and not terribly precise: It’s barely usable, and only a step or two above using a CCD or DVD as a grating. In fact, it’s arguable a DVD is better, since it’s reflective and more efficient.
Still on the lookout for a sub-$20 blazed reflective grating. Or a sub-$50 focused one.
Using a PCB stencil for a slit though: that’s genius!
Focused diffraction grating? Like single element? Hit me with link to example please.
Concave gratings are pretty much standard equipment in any high performance spectrometer these days…
https://www.edmundoptics.com/search/?criteria=concave%20grating&Tab=Products#
You are not wrong about the cheap diffraction grating. Other issues of our setup are the big size due to the focusing distance of the lens, and fiddly manual alignment/focusing when the setup is moved around.
For that reason, I recently salvaged the optical package from a blood analyzer which I plan to retrofit with this sensor.
For the DVD and BluRay gratings… I’m planning to use a HD actuator for sweeping. Will be interesting to see about transmission and reflection versions performance also since the discs can be split carefully too.
Also, planning to use a laptop CD/DVD sled mechanism for changing the slit width. What would be really awesome is being able to use CD/DVD/BluRay optics since are so cost effective and plentiful.
I’m still waiting on a cost effective laser disc player for those components for an even more advanced design.
Really great comments thread also with this build. Neat!
Great timing for your finishing your projects also. :-|) Man, we’ll see how this winter season progress goes.
Forgive my ignorance, but I’m trying to understand why a one-line sensor is any better than a regular monochrome camera sensor. The spectrograph he built passes the image through a slit (1D) to land on a diffraction grating (spread to 2D), which is then photographed by the 1D sensor. Now you many only be interested in the spectrum spread of one point, but wouldn’t you get a whole line of different possible sources’ spectrums with a full 2D sensor? It’s the diffraction grating doing the spectrum-analyzing work, not the sensor itself.
A dedicated linear spectrometer sensor like this has tall, skinny pixels: it allows integrating right at the sensor rather than after digitization. It yields lower readout noise, higher dynamic range, much faster readout, and lower overhead for your host processor.
Re 2D vs 3D: Technically, the slit could be just a pin-hole which would result in a 1D spectrum (thin line). But it’s more practical to cut that line from 2D projection of the spectrum, which a line sensor does. When using a 2D sensor, software extracts the 1D line of interest from the 2D image.
As Paul mentioned, line sensors typically are more sensitive than regular image sensors. The reason is pixels that are physically larger than on your typical 2D sensor. On the epc901 a pixel measures 7.5 x 120 micrometer. As a reference, the pixels on the RPi HQ camera modules are 1.55 x 1.55 um, or 375 times smaller in area.
And in fact in very low light situation it’s better to use a 2D CCD sensor, align the columns with the spectra and shift together as much row as you need in the ouput shifter to increase sensitivity and lower noise (a basic n-binning).
I’m not well versed in this stuff, but if you want a high resolution single line image sensor, maybe the Canon LIDE scanners are worth a look. They have a CCD sensor that runs the width of a page with many thousands of detection points. My LIDE 70 specs optical resolution of 2400 dpi, and the LIDE 200 is spec’d at 4800 dpi (x 8.5″!). Used LIDE scanners are available very cheaply, especially since most (all?) are no longer supported in Windows. I have no idea what it would take to read the sensor…
I haven’t looked at the LIDE units .. but too wide becomes a problem. Lenses can’t focus properly across a really wide sensor area. The linear sensors with the highest resolution have pixels that get too small for most spectroscopy, because the light levels per pixel are too low. And the resolution achieved along so many elements is typically 12 bits, while good spectroscopy typically needs 16 bit ADCs.
The flatbed scanner sensors are small (3 inches long, or less) and focused down from page size (mirrors + lenses). They frequently have 16 bit/channel, but are also frequently RGB patterns – some linear, some bayer. They almost always include an IR rejection filter. And they are not low noise by any means. I’ve used flatbed and handheld scanners for spectroscopy (with surplus gratings) – they work, but not well (better than webcams, though).
Is using a BGA to SMT like this https://www.advanced.com/products/bga-socketing-systems?gclid=Cj0KCQiAkuP9BRCkARIsAKGLE8VehX4n47qH5cywsY4iIdBud5q6U6Fezjr7tzR_qvTkEjdKV9mJBxEaAkgQEALw_wcB possible? Would it make it more complicated?
I doubt that there are sockets for this specific form factor (2×16 balls). And even if a socket exists, you probably could waste 10 sensors for the price of one socket. Also a socket can’t clamp down from the top, that’s where the light is supposed to enter. :)
This was my first project using a BGA part, and I managed to assemble 2 out of 2 without any issue. IMO difficulty is comparable to a QFN, except that the part is fragile and the topside must be kept clean of flux. I use an unmodified toaster oven, a hot plate probably works too, hot air may be problematic.
Thanks for your great info. This is an amazing build
Depending on the manufacturer they may give you the photo cell sensitivity curve, with real numbers (woo)
So you may just need to ask.
Unfortunately a more difficult method would be to make a calibrated light source or find one then use that to find what the curve is and strength is.
The sensitivity and spectral response curve is in the datasheet.
That’s a start but it’s not sufficient: you also need to include the spectral response (efficiency) of the grating and whatever other optics are in the system. There is often an order filter included, for example.
Fortunately, sunlight is pretty well characterized if you know your local time, latitude and altitude, and can be used to get a reasonable calibration.
Most applications don’t require really accurate calibration though: most quantitative work with spectrometers is done with differential measurements.
You could make a blood oxygen analyser on steroids: measure O2, displacement by CO2 over time/concentration, and even permanent displacement by CO.
3D printed case is quite bad choice, because it let infrared to pass through and end of the day it reduces the SNR.
Hi great project! Could you tell me how the data is send from the nucleo to the py script? What if I hook up a raspberry pi to it and use a gui to transform the data? Or is the GUI you have written easily adaptable for a raspberry pi. In standalone application?
Best regards
Bastiaan
The firmware implements a shell accessible over the serial port. Image data is transferred as 12-bit hex array (3 characters per pixel, 3096 characters per frame). I wrapped that interface into a Python API. See:
https://github.com/astuder/epc901#shell
The Python apps that come with the project are pretty bare bones and should work on a Raspberry Pi as is. It’s just some basic examples of Matplotlib banged into submission. I’m not much of a Python or GUI developer :)
Hey Adrian. Great project, I’m actually quite interested in ‘replicating’ this setup but for a different purpose in the world of spectroscopy. I’m pretty new to working on building projects and I would love to learn more from you.
Would you be interested in having a quick chat about this?
You can find contact information on my Github page. You may have to be logged in to see it.