A barograph is a device that graphs a barometer’s readings over time, revealing trends that can predict whether stormy weather is approaching or sunny skies are on the way. This DIY Digital Barograph, created by [mircmk], offers a modern twist on a classic technology.
 Dating back to the mid-1700s, barographs have traditionally used an aneroid cell to move a scribe across paper that advances with time, graphing pressure trends. However, this method has its shortcomings: you must replace the paper once it runs through its time range, and mechanical components require regular maintenance.
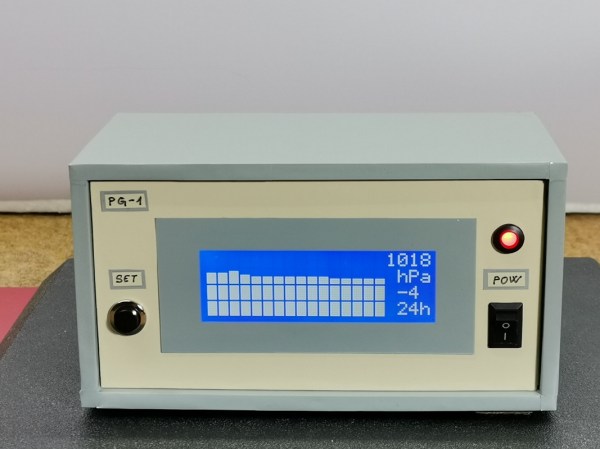
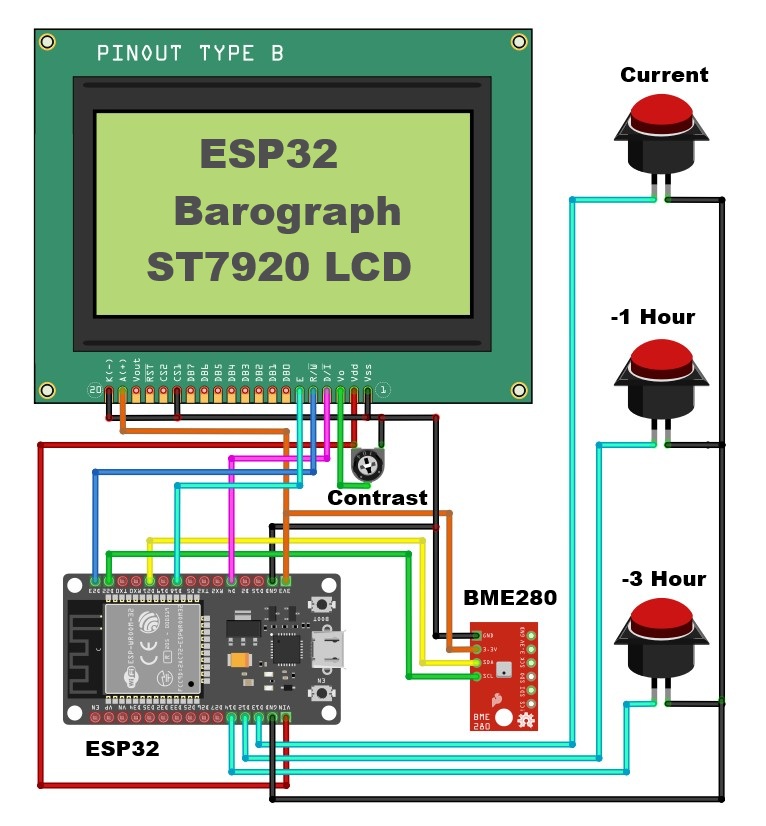
[mircmk]’s DIY Digital Barograph ditches paper and aneroids for a sleek 128×64 LCD display that shows measurements from a BME280 pressure sensor. Powered by an ESP32 microcontroller — the code for which is available on the project page — the device checks the sensor upon boot and features external buttons to cycle through readings from the current moment, the last hour, or three hours ago. Unlike traditional barographs that only track pressure, the BME280 also measures temperature and humidity, which are displayed on the screen for a more complete environmental snapshot.
Head over to the project’s Hackaday.io page for more details and to start building your own. Thanks to [mircmk] for sharing this project! We’re excited to see what you come up with next. If you’re inspired, check out other weather display projects we’ve featured.
Continue reading “From Paper To Pixels: A DIY Digital Barograph”