Astronomy fans were recently treated to the Great Conjunction, where Jupiter and Saturn appear close together from the perspective of our planet Earth. Astronomy has given us this and many other magnificent sights, but we can get other senses involved. Science News tells of explorations into adapting our sense of hearing into tools of astronomical data analysis.
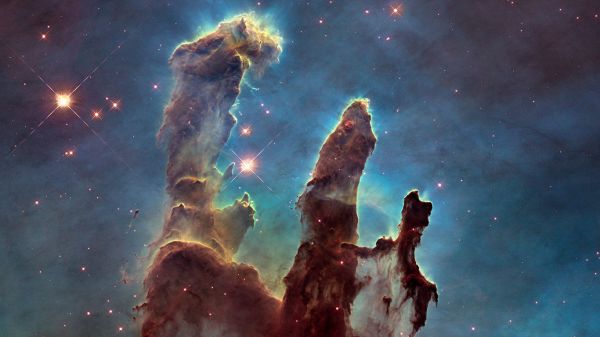
Data visualization has long been a part of astronomy, but they’re not restricted to charts and graphs that require a trained background to interpret. Every “image” generated using data from radio telescopes (like the recently-lost Arecibo facility) are a visualization of data from outside the visible spectrum. Visualizations also include crowd pleasing false-color images such as The Pillars of Creation published by NASA where interstellar emissions captured by science instruments are remapped to colors in the visible spectrum. The results are equal parts art and science, and can be appreciated from either perspective.
Data sonification is a whole other toolset with different strengths. Our visual system evolved ability to pick out edges and patterns in spatial plots, which we exploit for data visualization. In contrast our aural system evolved ability to process data in the frequency domain, and the challenge is to figure out how to use those abilities to gain scientifically relevant data insight. For now this field of work is more art than science, but it does open another venue for the visually impaired. Some of whom are already active contributors in astronomy and interested in applying their well-developed sense of hearing to their work.
Of course there’s no reason this has to be restricted to astronomy. A few months ago we covered a project for sonification of DNA data. It doesn’t take much to get started, as shown in this student sonification project. We certainly have no shortage of projects that make interesting sounds on this site, perhaps one of them will be the key.


