It’s been a project filled with fits and starts, and it very nearly ended up as a “Fail of the Week” feature, but we’re happy to report that the [Thought Emporium]’s desktop WiFi radio telescope finally works. And it’s pretty darn cool.
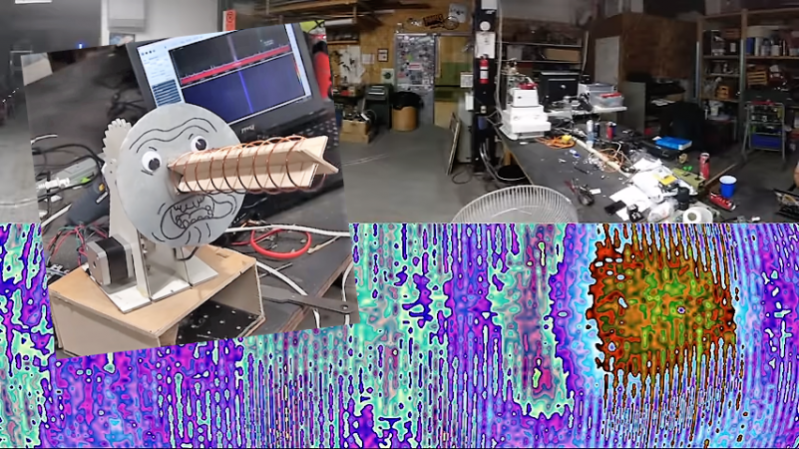
If you’ve been following along with the build like we have, you’ll know that this stems from a previous, much larger radio telescope that [Justin] used to visualize the constellation of geosynchronous digital TV satellites. This time, he set his sights closer to home and built a system to visualize the 2.4-GHz WiFi band. A simple helical antenna rides on the stepper-driven azimuth-elevation scanner. A HackRF SDR and GNU Radio form the receiver, which just captures the received signal strength indicator (RSSI) value for each point as the antenna scans. The data is then massaged into colors representing the intensity of WiFi signals received and laid over an optical image of the scanned area. The first image clearly showed a couple of hotspots, including a previously unknown router. An outdoor scan revealed routers galore, although that took a little more wizardry to pull off.
The videos below recount the whole tale in detail; skip to part three for the payoff if you must, but at the cost of missing some valuable lessons and a few cool tips, like using flattened pieces of Schedule 40 pipe as a construction material. We hope to see more from the project soon, and wonder if this FPV racing drone tracker might offer some helpful hints for expansion.


https://www.youtube.com/watch?v=F1xAUfdK9FE
;)
Glad you liked the project!
It only seemed as rocky of a path as it was because I decided to go with a weekly update format rather than the usual full story in one video. The last time was way more difficult and ten times as frusterating. This was honestly pretty smooth for us only working on it for a few days total over the 3 weeks. I think I’ll stick with this format moving forward as it lets me tackle bigger projects without having to rush and I feel like it shows that every failure can be overcome if you’re as bull headed and persistent as we are! Besides I’m a biologist at heart. I’d be a really crappy one if I was afraid of a little failure. Nothing says a fun Saturday like an organism you’ve been working on for weeks dying and having to start again.
We have so much more planned, it’s only going to get crazier from here. Just wait till you see the big one….. We’re gonna have to make it collapsible just to be able to transport the damn thing.
Thanks for the share!!
Oh those organisms!
Silly little lifeforms.
https://www.youtube.com/watch?v=dWBmaKk32fE
Greetings,
I want to make this project as my final year project. can you please provide me some more information regarding this project like the diagrams, schematics, circuit diagrams and most importantly the applications of the project???
please kindly help me by responding me ASAP cause it is my final year project and I want to build this in the coming few months.
your cooperation will highly be appreciated.
Regards
Email: alibayat1994.af@gmail.com
+92 333-1512-042
It would be cooler to pick out cell phones and then trigger a super soaker to squirt people
would be neat to stick a bright RGB led on the end of that antenna, stick it in a pvc tube and make a flashlight formfactor. heat map signal strength. Paint a representation of the rf environment either live or using a long exposure. Think someone did that here thermally with a lepton or something. I do a tonne of consulting to wisps – explaining rf to building managers and customers is always a testing process. Be rad to be able to visualise signal propagation on the fly.
>Think someone did that here thermally with a lepton or something.
They may have, but someone else did it with an ESP8266: https://hackaday.com/2015/02/17/mapping-wifi-signals-in-3-dimensions/
It may be better to use two (less) directional antennas and combine them out of phase. The bull in the antenna pattern will be much more pronounced than the peak.
The vertical stripes in the data in alternating columns suggest that there is a bug that could be fixed. Using a standard color map instead of a RGB sawtooth would also make it easier to tell what is going on – try plotting the power (the original floating point values in decibels) with matplotlib and it should look like the concept art in the part 1 video.
Pretty certain the stripes are because their boustrophedon scanning isn’t correctly aligned.
I wonder how if this could enhance wigle.net ?
“Maps and database of 802.11 wireless networks, with statistics, submitted by wardrivers, netstumblers, and net huggers.” (FTW)
Love the whimsical antenna.
If you really want good images, get a dish. Looks like you used one in an earlier project, but 2.4GHz dishes can be found with nice feeds for not much money. Think I paid about $15US for mine at a hamfest.
If you are looking to move into drone tracking or basically auto-tracking any signal, here is a method I know of and is used on Air Force Satellite systems I have worked with. Essential you put four highly directional antennas around your central feed and compare signal strength on them. When they are all the same, you are on track (essentially they are all receiving an equally off target signal). If signal strength on one of your antennas is better than the one opposite it, then you must move your antenna TOWARD that side (because it is actually coming into line with the signal meaning your main antenna is coming out of line) until you get balance again. Essentially you are trying to balance a bridge and one way to do it is just detecting current flow in the bridge as an error to drive a tracking motor.
This is something I’ve been interested in for a long time. We have access to many sensors which let us view the outside world, but we miss even in our own lives the RF spectrum. We treat transceivers as magic boxes that send information, not thinking about how RF fills the space around us. I’m glad to see a project like this come to fruition.
I imagine viewing RF in all it’s glory is like viewing odor in all theirs.
Is it just me, or does this dude sound an awful lot like Will Wheaton?
WW needs to make a living somehow.
B^)
A very interesting project! I am curious as to what the gain of your antenna was. I did a little bit of Wi-Fi area scanning a few years ago when a group was trying to build a community Wi-Fi network. I was using a 15 dBi panel antenna, but the commonly used cantenna made from a Pringles can was also an option with similar performance.
So much processing! A good old analog meter that just gives one value that is essentially time averaged would serve the purpose if there were a way to get that data into your grid.
Yep. Too much data. This reminds me of when I saw a device that had an micro PC attached inside to just show a number on a display. We replaced the $400 PC with a $20 OSD chip. Honestly, this is a cool project, but looks like they make life harder than it needs to be, just wire up a 2.4GHz and 5GHz front end and read the analog value like your idea of an analog meter.
This is very cool. And it cries out for a followup with a couple antennas in an interferometer!
Very cool, congrats!
I had a thought of something you could maybe add, a small video camera to also show an visual image of what it was actually scanning at that point in time. Positron Emission Tomography (PET) is looks kinda of like your radio scans along, but doctors usually to a PET/CT (adding in a CAT scan like you were doing with panning). But the camera+radio antenna can grab it both all at once.