[Randall Munroe] certainly understands the power of graphical representation of data. The humorous plots in his xkcd webcomic are one of the favorite parts for many readers. Their distinctive, Tufteian style delivers the information – in this case, a punch line – without excessive decoration. To be honest, we can’t get enough of them. A recent reddit thread reminded us that you can generate a similar look for your own data (humorous or otherwise) in Python using Matplotlib.
If you already have a plot generated with Matplotlib, activating xkcd-mode is as simple as calling a method on the pyplot object:
matplotlib.pyplot.xkcd()
The documentation recommends that you install the “Humor Sans” font for best effect. On one of our linux boxes, we were able to do this with a simple:
sudo apt-get install fonts-humor-sans
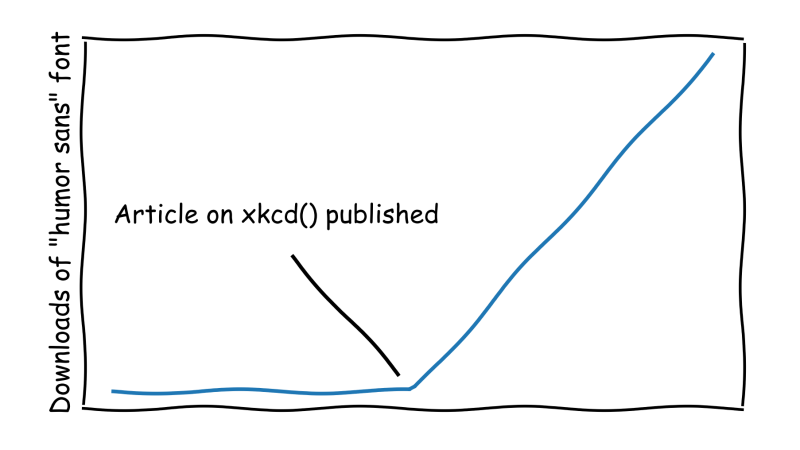
There will undoubtedly be similar incantations for other operating systems. It’s really that simple. In fact, the featured image above was generated with this minimal script:
#!/usr/bin/env python3

import numpy as np
import matplotlib.pyplot as plt

x = np.linspace(0, 1, 100)
y = (x > 0.5) * (x - 0.5)

plt.xkcd(scale=5, length=400)
plt.xticks([])
plt.yticks([])
plt.ylabel('Downloads of "humor sans" font')
plt.text(0, 0.25, 'Article on xkcd() published')
plt.plot(x, y)
plt.plot([0.3, 0.475], [0.2, 0.025], 'black')
plt.gca().set_aspect(2*9/16)
plt.savefig('xkcd_plot.png', dpi=300)
Beyond generating humorous graphs for those with little artistic talent, these plots can also be used instead of hand-drawn sketches to indicate a simple model or expected result. The comic look of the plots conveys the idea that they don’t represent actual data, perhaps only a concept. We saw this done at one of the talks at the Hackaday SuperConference 2018.
We’ve also covered some of the xkcd comics before, such as when they subtly dissed Arduino back in 2010, before that was cool.


Unluckily the xkcd font (still!) lacks international characters.
Now I’m forced to only publish my graphs in an english context… :-(
WHAT HAVE YOU DONE?!?!?!!?!?!?!…
For _English_ contexts you need fonts-humour-sans.
Or font- humourless-sans
Will this work from GNU Octave? Anyone?
I hope so … would be just in time for my phd final paper !
No, it’s limited to the maptlotlib library in python. Matplotlib has a matlab-like interface though, so if you aren’t doing anything too fancy it probably wouldn’t be difficult to port the plotting code.
If i have to make a plot for work, this is what’ll use.
I will now be using it for almost all my plots… :-)
You’ll get fired!
I won’t. It’s not that uptight here. Besides, who ever reads specs?
Noooo, you need it in uppercase ! What’s all this lowercase BS :/
Done in Matlab 7 years ago! shows that Matlab is clearly superior
Initial pull request was in 2012 too: https://github.com/matplotlib/matplotlib/pull/1329
Initial pull request (matplotlib github, pull/1329) was in 2012.
Haven’t you run this before? Or perhaps it was a comment by a reader? I recall using it from a link I’m sure was on HaD. https://nbviewer.jupyter.org/github/ARMWorks/IPNB/blob/master/sampleIPNB.ipynb
Why would you use humor sans when randal already made his own XKCD font?
xkcd.com/fonts/xkcd-Regular.otf