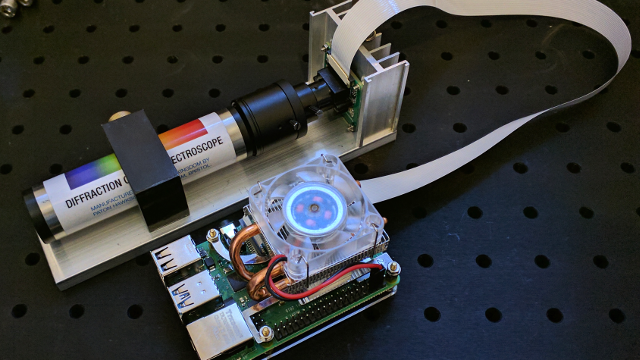
Play around with optics long enough and sooner or later you’re probably going to want a spectrometer. Optical instruments are famously expensive, though, at least for high-quality units. But a useful spectrometer, like this DIY Raspberry Pi-based instrument, doesn’t necessarily have to break the bank.
This one comes to us by way of [Les Wright], whose homebrew laser builds we’ve been admiring for a while now. [Les] managed to keep the costs to a minimum here by keeping the optics super simple. The front end of the instrument is just a handheld diffraction-grating spectroscope, of the kind used in physics classrooms to demonstrate the spectral characteristics of different light sources. Turning it from a spectroscope to a spectrometer required a Raspberry Pi and a camera; mounted to a lens and positioned to see the spectrum created by the diffraction grating, the camera sends data to the Pi, where a Python program does the business of converting the spectrum to data. [Les]’s software is simple by complete, giving a graphical representation of the spectral data it sees. The video below shows the build process and what’s involved in calibrating the spectrometer, plus some of the more interesting spectra one can easily explore.
We appreciate the simplicity and the utility of this design, as well as its adaptability. Rather than using machined aluminum, the spectroscope holder and Pi cam bracket could easily be 3D-printer, and we could also see how the software could be adapted to use a PC and webcam.


nice HW/SW project and very well explained
Thanks! :-)
Hi Les,
Do you have an email address, I could write to you about some technical questions?
Thanks,
Will
great work!
Cheers, glad you like it!
Heck yeah man, this is what every project documentation should be! I’ve got no need for a spectrometer, but this seems like a no brainer to build and get 2-3nm vs buying something with 15nm. Keep up the good work Les!
Thanks! When I decided on the build, I was honestly surprised nobody had written software for the Pi! From comments on YouTube and requests on GitHub, this thing will be growing arms and legs. Cheers!
Could this be used as a spectrophotometer?
Sure, I don’t see why not! You would need a known broad band light source. If you were so inclined you could modify the software to flatten the initial curve and have it detect dips instead of peaks.
The software has not been refactored yet (it’s still a work in progress), so it’s not super tidy in there, but the source is well commented throughout. At the moment, being the initial release, there are not that many bells and whistles either, so it is not overly complex to understand.
Cheers!
Les
This would be a great addition to one of those “real life tricorder” builds, if miniaturized a bit.
I came here to say that.
They seem pretty popular lately. It would be interesting to see how small you could build a spectroscope. Hamamatsu did it, so with some care it might be possible with a mini picam and a steady hand!
Well, it’s becoming more and more common to explore previously unexplored planets, so it’s really a practical necessity to be able to assess safety and to analyze whatever strange things are found there.
Also, everybody has smartphones and those immediately give you half of the project for free, so that must be helping too.
Done! : https://www.youtube.com/watch?v=Tw3HJEhE2dI
Genius! Thanks for the link!
You could improve the resolution of this to pretty extreme levels using a bit of optics (microscope lensing) and a stepper motor:
Add a mirror to the shaft of the stepper motor, so you can use the stepper motor to select what part of the spectrum the camera is pointed towards, and use a microscope to have the camera (you can just use one of those USB microscope cameras, I have a few, and they are very very neat) “zoomed in” to that part of the spectrum.
This way, you can then tell your stepper motor “turn to 53 degrees”, which in turn means “put the zone from 301 nm to 303 nm into focus”, and the microscope allows you to actually see that close to it.
Now you are no longer limited to looking at all the spectrum at once with one frame of the camera.
You can use one frame and stepper motor position/angle per range of the spectrum, and you can even use video capture to capture all the spectrum (by “scanning” using the stepper motor at the same time you record video) in a few seconds.
This way you get tens or even hundreds of times more resolution on your spectrum, by adding just a stepper motor and a lens.
I think this is fairly straightforward, I do not see where this could go wrong or get too complex (assuming enough care is put into assembly), I wish I had the free time to actually do this, it sounds like a mountain of fun.
Yes, this would certainly be possible, but not with the pocket scope I am using I suspect.
Resolution would ultimately be determined by the diffraction grating. See: http://hyperphysics.phy-astr.gsu.edu/hbase/phyopt/gratres.html
That said, with a custom built spectroscope, what you suggest is well within reach for amateur construction.
Yeah, lack of free time for me at the moment is partly the reason for the simple build, but I will keep picking away at it. I’m hopeful other will too. There is some interest from the amateur astronomers, physicist and chemists, so I’m hoping people with time, make it fit their needs.
Cheers!
Les
Mind trying to do a “layman” explanation of the resolution limitation?
The link isn’t really helping me.
Also, what’s wrong with the “pocket scope” you are using?
About “others will too”, do you plan on publishing your plans and other project files to github so others can try reproducing your work, and possibly improving on it, and sharing their progress in a way you’d potentially then benefit from too? You know, the whole open-source thing.
If you want a free Smoothieboard for the stepper motor control of trying this out, or for any other project you might have, don’t hesitate to ask, I’ll be glad to help with that hardware, or in any other way I can.
Diffraction gratings are constructed of ruled or etched lines on a substrate. The more lines per mm, the higher the resolution.
The pocket scope, while pretty cool, is unlikely to have a grating of much over 1000 lines/mm and has a narrow field of view, so for what you describe, a custom spectroscope would need to be constructed.
Yep, it’s linked to in the video description: https://github.com/leswright1977/PySpectrometer
Cheers, if it ends up going that way, I will certainly ask.
Cheers!
Les
It sounds like you should be able to use something else than a diffraction grating, like a more traditional optics prism, and get around this limitation with your resolution limited only by the zoom of the microscope, no?
Also, thank you very much for your explanation.
The number of grating lines that are used in the dispersion limit the resolution. Look at slit experiments from physics. One slit, then two slits, then many slits. As you have more fringes from which the light is diffracted, you get better resolution of wavelength dispersion in the far field.
You will also get to a point where the spectrometer resolution is limited by the range of angles from the input slit width. Make the slit more narrow and you don’t have enough light for the camera to have a high signal to noise. Make the slit too wide and the angles formed by light at the edges of the slit cause different wavelengths to overlap at the detector.
Thank you for the explanation!
There was something about using a heat cut fragment from a dead burned Blu-ray recordable as a spectroscope.
I know that DVDs also work for this but the angle is smaller.
So, how to calibrate the amplitude? I doubt the sensor of the pi cam has a flat frequency response. The OpenCV BGR2GRAY conversion also has to be taken into account.
Maybe point it at the sun?
The sun is not a good reference:
https://en.wikipedia.org/wiki/Sunlight#/media/File:Spectrum_of_Sunlight_en.svg
An incandescent light bulb? But the “Ultimate Light Bulb Test” on Popular Mechanics shows that even these have different spectra (I guess due to the glass).
Not only the camera, but the whole setup. The diffraction grating itself, and any lens has to be accounted to in the calibration. Getting a super stable broad spectrum light source with an accurately known spectrum isn´t easy or cheap…
Are you asking about amplitude, or relative spectral position of the peaks?
If it’s the latter then find a fluorescent lamp that still contains mercury. The mercury emission line is sharp and has a well defined position just at the short edge of the spectrum. This method was used in the days of monochromators (only an actual lamp containing pure mercury vapor was used)..
However, if you’re talking about the amplitude (i.e. peak intensity) then I’m afraid you’re out of luck. This is quite difficult to achieve..
Good comments guys. The response is not dead flat, but it’s not unreasonable, link here: https://www.scivision.dev/raspberry-pi-ov5647-camera-spectral-response/
For qualitative amplitude measurements, it is just fine.
These are color cameras, and so they have an RGB filter right on the silicon. At least one university managed to remove one from a picam to do UV work, but the process looks like something of a chore.
For ‘real’ spectrometers, a linear B&W CCD is used with known certified response curves.
A ‘standard’ light source, is something that will need investigating. Surely they exist!
I would buy two cheapo 25¢ leds on either end of the spectrum. Just like calibrating a pH meter, once you have two known reference points, you’re all set. It doesn’t matter how dirty the emission is, as long as there’s a defined peak. So, a red led is probably around 680nm, and a blue one around 450nm. So, prioritize your led purchase on one that comes with known emission spectra. You definitely don’t need to be perfect because it’s repeatable. And reproducibility is far far more important than accuracy. Then start logging data. Now… Someone should shine a full spectrum flashlight at fruit (maybe a cantalope) , and log the reflection spectra along with how sweet it tasted. Once you’ve identified the optimal spectra response for perfect fruit, take that flashlight and spectrophotometer to the farmer’s market, and shop the geeky way :P Surrounding light won’t matter as long as you’ve mapped a scatter plot of peak emission for the fruit. Your flashlight will out-complete with background light. A shroud would certainly help though. This light absorbance approach should work with any assay. You could measure lawn nutrient deficiencies, aquarium water health, paint color swatch matching, leaf species, etc. The most important component is the reference data. Ok, I’ll stop now.
The sun does a good job as a cheap test source. Otherwise a high temperature tungsten halogen bulb is reasonable. NIST has great reference papers freely available on this. They have very expensive calibration sources, but for quick hobby purposes that’s not necessary.
You can find a relative amplitude fairly easily in a couple of ways. One is by using a reference source and subtracting it from your sample spectrum. Or use a ratio between a reference and the sample. The difference method is baked into the operation of some classic absorption spectrometers through chopping of the signal with a rotating mirror. One path goes direct to the detector and the other path goes through the sample material. If the ratio of of these two signals is used, variations in the light source are automatically compensated. (Actually in old school systems feedback is used to get the output from a difference scheme. A variable aperture driven by a servo is used to make the reference beam have the same magnitude as the sample path. The motor drive then becomes the output spectra.)
In this device, a photo-diode can be used as a broadband detector and could look at the same source as the spectrometer and serve as a reference. This is really a neat project with tremendous opportunity for variations.
What could be used to characterize lengthwave of unknown IR LEDs? This setup seems to top around 650/700nm, when 700/1000nm range would be necessary for IR.
The software calculates the scale, the graticule lines and the labels when you calibrate, so you can easily set it up to do 700-1000nm.
The spectroscope itself might not go that far. If I get time, I will test it.
The camera is probably not very efficient at detecting light above about 800-850 nm. My guess is it will just look like camera dark noise above about 800 nm.
Not if you remove the IR filter..
Silicon is responsive up to about 1100 nm. Sure the QE may be bad, but you’ll still get more than noise. Even better if you can cool the sensor.
I’ve built a similar spectrometer using a slit and 1000 line/mm diffraction grating instead of the nifty spectroscope Les Wright used. I used one of the raspberry pi high quality cameras with the IR filter removed and the resulting spectrometer seems to be useful from roughly 350nm to about 1200 nm. It does a very good job sorting 720nm, 780nm, 850nm, and 940nm LEDs.
Any chance you’ve got this documented somewhere? I’m trying to put together plans for a diy spectrometer that covers the visible spectrum up into the 900-1000 range.
Many scientific measurements are ratiometric – i.e., you measure the system response (‘background’ or ‘reference’) using the source and a ‘white’ reflector, or in transmission (‘open beam’ or ‘reference’) The you measure the spectrum of the source reflected off the sample, or transmitted by the sample. Then you ratio sample/reference. If you take the negative log of that, you end up in absorbance units, which are linear with concentration. That’s how quantitative colorimetric assays are done (e.g, for drinking water.) Check out any basic book on UV-visible spectroscopy (or near-infrared, mid-infrared, etc.). See also: https://publiclab.org/
You can also use crossed transmission gratings to improve both the spectral resolution and the dynamic range. See: https://www.spectroclick.com/
If you want to use a smartphone as the detector (i.e., camera), then see: https://www.sciencedaily.com/releases/2019/06/190624120237.htm
Smartphones do a lot of processing on camera data before you see it, so you need to intercept the data at the earliest possible stage!
Dear Les,
I really enjoyed your video and recreated the pyspectrometer. It works excellent.
I would like to use it to record electrogenerated chemiluminescence in the physical chemistry lab.
Next I will turn to your dyelaser project.
Best redards from Germany,
Achim
Hi! for the miniaturized version of the pyspectrometer are these good https://www.amazon.it/dp/B07G9VLPZH and
https://www.amazon.it/dp/B00MNEAMF4 ? thanks a lot.