Last month we featured a project that aimed to recreate the iconic mechanical VU meter with an Arduino and a common OLED display. It was cheap and easy to implement, and promised to bring a little retro style to your otherwise thoroughly modern project.
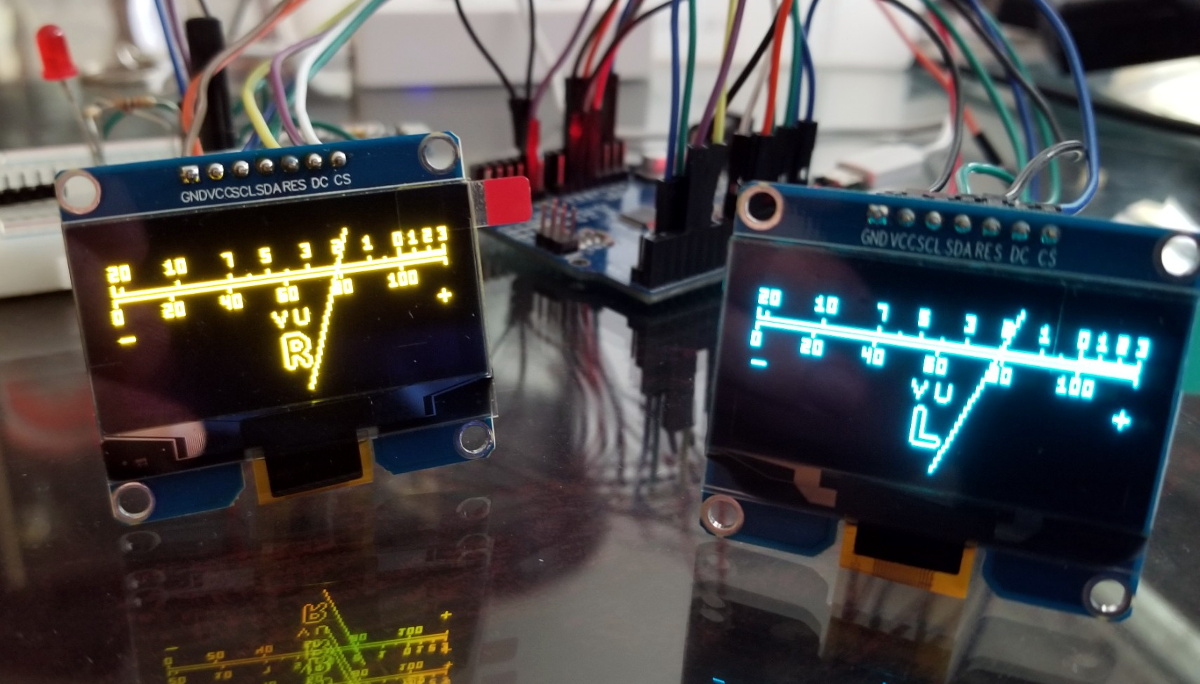 [sjm4306] liked the idea, but thought it was a tad too stiff. So he’s been experimenting with adding some physics to the meter’s virtual needle to better approximate the distinctive lag and overshoot that’s part and parcel of analog indicators. Obviously it’s something that can only be appreciated in motion, so check out the video below for an up-close look at his quasi-retro indicator.
Unfortunately there’s no code for you to play with right now, but [sjm4306] says he’ll release it on the project’s Hackaday.IO page once he’s cleaned things up a bit. We know it will take more than a few wiggling pixels to pry real analog indicators out of some hacker’s tool boxes, but anything that helps improve the digital approximation of this sort of vintage hardware is a win in our book.


As I recall, a proper VU meter is well specified, including how fast it follows the signal.
But most of the time, hobbyists were deally with cheap meters that showed relative levels.
The BBC didn’t use VU meters to control levels in broadcasting, but the PPM or Peak Programme Meter, which defined the levels and also the ballistic properties of the meter needle. There’s a description and circuits here:
https://www.muzines.co.uk/articles/the-peak-programme-meter/4285
This is pretty cool but after a bit of use you’d see why one of the selling features of better audio gear was always better VU meters.
The glance value of information with an underdamped needle is nil and they’re maddening to work with – one of the reasons that LED bar graphs took over. The flip side of that is, of course, that you could ride the slightly laggy peaks over a value and the oscillation in the meter system would provide enough of a rough average keep you from oversaturating the recording (mostly), something that was mimicked in later LED displays (and the meters in software programs like Audacity).
The point? This is appealing and really well done, but the “underdamped” as it stands would probably be set aside pretty quickly if the VU meter were actually used for something. Just enough lag and damping would introduce the averaging I described and is an intuitive aid to audio work.
Since I saw that last VU meter project, I’ve been wondering:
Reproducing the response of electromechanical meters is great for anyone accustomed to them, but, is that response the best for the job, or just a standardization of what could be attained reasonably at the time? Would any actual audio engineer want a different characteristic or metric?
Seems to me it’s just for aesthetics/show, because it will not show actual/accurate readings
Good, but even if it were accurate and conformal to the the desired standard (ANSI, PPM), is that the best thing?
If a digital meter is constantly changing, do you get a feel for how much it is changing?
Is a single number enough data from a multimeter? Knowing the voltage to one decimal place is useful, but you only know the peak or average, depending on the meter. Knowing how stable that voltage is can be useful too. A classic VU meter gives you both of those data points.
Useful for some, not so for others.
What you say makes me think: this emulation of a VU meter could be better than a real needle because the virtual needle doesn’t to be a constant width. Instead, it might plot a moving min/max/average.
I actually clicked through to specifically say that a VU meter that doesn’t mimic the physics is useless as a meter. The human ear is an analog system, and it reacts to volume very much like the needle on a VU meter. VU meters were designed for analog systems feeding analog ears. Most analog engineers would rather take a little overdriving (for a split second) rather than a muddy signal down in the noise. The system can handle that brief jolt just as well as a listener. A bouncy, jittery needle (frankly like a lot of LED meters) just isn’t very useful for riding an analog level.
Digital signals are different. Even a tiny bit of clipping is an auditory disaster, so you need different meters.
This is awesome! Imagine using such an OLED Display as the “Wallpaper” for a real electro-mechanical Instrument! It could serve both as a static Scale (Numbers, Markers) for the physical Meter, but could also act as an accurate digital Meter with/without that bouncy Delay. Or as a second instrument. That way, People could have the best of both Worlds without “wasting” any Space. :D
Indeed… the entire meter could change in sympathy with the level… green/blue for low levels, yellow/orange for usual levels, and red for overdrive. But even as I type I’m thinking an RGB LED would be simpler and more cost effective for such an endeavour.
However, the meter background could display other interesting things that an RGB LED couldn’t… like implementing a peak hold…
skeuomorphism gone sadly askew
Awesome project! Thanks for sharing.
As mentioned above, the meter in Audacity! First switch off that mixed color background which is on by default. Then enjoy the best meters around. They display RMS, average, peak for five seconds, and peak over the whole time they are not reset. That’s 4 stats in one display, un-nested you can blow it up to fill a screen to see at a distance.
I wish we could have it in VLC in a space saving bar mode. VLC’s meter seems to be peak but I’m not into needing space for the arc motion and (gasp) another gradient smear of colors instead of dB marks. I often have to check weak audio levels of streams or YouTube audio and I go and check with Audacity’s great meters.
This type of display could be done with the hardware here I assume.
I don’t think he knows what over-damped means. This takes me back a few years, but from my control systems courses, a critically damped system is one that overshoots once, then returns to the target value. Under-damped over/undershorts multiple times (he got that one right). Over-damped doesn’t overshoot at all, and takes its time to approach the target value.
Forgive me, it’s been over a decade since I was at uni and I’m more of a embedded software guy than physics/control theory so I mixed up critically and over. Thanks for the correction though, at least I’ve (re)learned something.
Not intended to be a correction, and certainly not a demand for apology. This is knowledge that we end up forgetting if we don’t pass it down. You didn’t live it — why should you know about it if people like me don’t transmit it? It’s like the P-38 can opener on my keychain. Why would the average 20 year old have any idea how to use it? I only know how to use it because someone older told me. Once you know, you need to pass it on.
(Youtube is actually great for this — I’ve recovered a lot of almost-lost knowledge for myself, and honestly I’m working on gaining as much early 19th century knowledge as I can before the next Carrington-level event.)
In either case I am actually happy to be corrected so long as it’s in a polite way. The worst thing imo is for me to walk around repeating something that’s incorrect and never learning from my mistakes.
“critically damped” is the minimum amount of damping that has no overshoot.
Any overshoot = underdamped.
Any slower than critically damped = overdamped.
I wonder what the psychrometric guys think of this comment thread…
VU meters indicate the average level of audio programming and they were ideal when you wanted to keep an eye on loudness, which is paramount for broadcasting. You want the listener to get a consistent apparent level, song to ad to news to song etc. VU meters were also ok for recording to magnetic tape, because analog recording to tape does not have a hard upper limit, just a point before which saturation starts happening. This point is dependent on tape used, head gap, bias frequency and level, and even the spectral makeup of the recorded sound. So the best you can hope for is to find a consistent average level that uses the tape’s dynamic range with the minimum of peaks running into the saturation area.
Digital recording, on the other hand has an absolute, rock hard maximum level point beyond which the signal is clipped hard. No forgiving saturation there! So peak metering is essential for digital recording… and that’s why you seldom see VU meters any more, kids.
I have a soft spot for VU meters and have a drawerful.
Well…. The specification for physical VU meters is a 300ms rise and fall time. Overshoot is to be less than 1 to 1.5% of scale. 0VU equals +4 dBu, or 1.228 volts RMS, a power of about 2.5 milliwatts when applied across a 600-ohm load.
The 300ms rise time is defined as: Rising from no signal to 99% of “0 VU” when a 1.228 VRMS 1 kHz sine wave tone is applied across a 600-ohm load for 300 milliseconds.
The fall time is the same value of 300ms from the removal of the signal (0 VRMS) from 0VU to the gauge stop.
This is called meter ballistics and there are a few standards and propriatary ones out there aside from VU.
Somebody up there was talking about PPM meters, which preceded VU meters in the invention timeline.
PPM meters have a rise time of 10ms and a fall time of 24dB in 2.8 seconds.
PPM meters are good for peak detections while recording, like snare drum hits which are short transients.
VU meters were developed to follow the “average” persons hearing of relative loudness (Volume Units).
So they are slower, like your brain-ear interaction.
If your virtual meters don’t follow those standards, then they are just dancing lights… :)