We all know we live in a soup of electromagnetic radiation, everything from AM radio broadcasts to cosmic rays. Some of it is useful, some is a nuisance, but all of it is invisible. We know it’s there, but we have no idea what the fields look like. Unless you put something like this 3D WiFi field strength visualizer to work, of course.
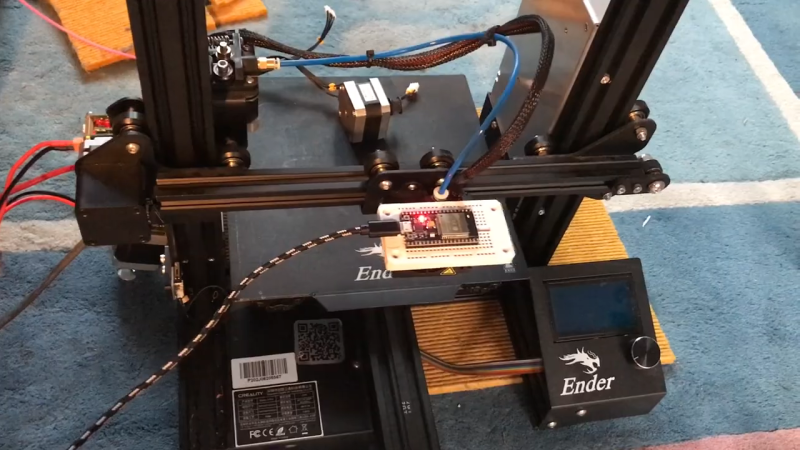
 Granted, based as it is on the gantry of an old 3D printer, [Neumi]’s WiFi scanner has a somewhat limited work envelope. A NodeMCU ESP32 module rides where the printer’s extruder normally resides, and scans through a series of points one centimeter apart. A received signal strength indicator (RSSI) reading is taken from the NodeMCU’s WiFi at each point, and the position and RSSI data for each point are saved to a CSV file. A couple of Python programs then digest the raw data to produce both 2D and 3D scans. The 3D scans are the most revealing — you can actually see a 12.5-cm spacing of signal strength, which corresponds to the wavelength of 2.4-GHz WiFi. The video below shows the data capture process and some of the visualizations.
While it’s still pretty cool at this scale, we’d love to see this scaled up. [Neumi] has already done a large-scale 3D visualization project, using ultrasound rather than radio waves, so he’s had some experience in this area. But perhaps a cable bot or something similar would work for a room-sized experiment. A nice touch would be using an SDR dongle to collect signal strength data, too — it would allow you to look at different parts of the spectrum.


Also see https://hackaday.com/2015/02/17/mapping-wifi-signals-in-3-dimensions/
Neat, but the printer would be attenuating the signal differently with each new position
Would there be a way to compensate for that?
One could mount the antenna at the end of a long plastic pole to put some distance between the metal parts and the radio signals.
Nobody claimed it was providing a perfect representation of the field as if it was in complete free space. And it’s not like this wifi module is ever going to be used in a complete ideal vacuum with no physical materials or other fields present in the surrounding volume. So why would *that* be more valid than *this*?
thanks for the ideas on how to calibrate one! I can build an antenna, model it in FEKO, and then we can test it! I love Hackaday!
Yes of course, but it’s fine to ignore this due to the multipath effects of signal propagation – really you should be taking a set of measurements at each position and calculating the median RSSI to get a better representative value as it likely wildly fluctuates. They’re basically printing a random number generator like this.
I will never need to measure wifi signals in the build area of my printer. But come on, we are hackers. Think of this as a proof of concept. Can nobody else see the utility in being able to measure “something,” then measure that “something” in many locations, then make a cool 3D visualisation? With similar tools, we could measure, I dunno, carbon monoxide in a basement using a little rover, or ultraviolet exposure in a garden, or use a drone to map the best GSM phone signal above your house so you know where to site your external antenna… Maybe I’m showing my age, but being able to throw together a 3D map of something invisible that you have measured yourself still seems pretty cool to me.
Nice comment (after 4 years ahah)