If you’re dealing with a chronic illness, the ability to continuously monitor your symptoms is indispensable, helping you gain valuable insights into what makes your body tick – or, rather, mis-tick. However, for many illnesses, you need specialized equipment to monitor them, and it tends to be that you can only visit your doctor every so often. Thankfully, we hackers can figure out ways to monitor our conditions on our own. With a condition called BPH (Benign Prostate Hyperplasia), one of the ways to monitor it is taking measurements of urinary flow rate. Being able to take these measurements at home provides better insights, and, having found flow rate measurement devices to be prohibitively expensive to even rent, [Jerry Smith] set out to build his own.
This build is truly designed to be reproducible for anyone who needs such a device. Jerry has intricately documented the project and its inner workings – the 31-page document contains full build instructions, BOM for ordering, PCB description and pinout diagrams, calibration and validation instructions, and even software flowcharts; the GitHub repo has everything else you might need. We’re pleasantly surprised – this amount of documentation isn’t typically seen in hacker projects, and is even more valuable considering that this is a medical device that other hackers in need will want to reproduce.
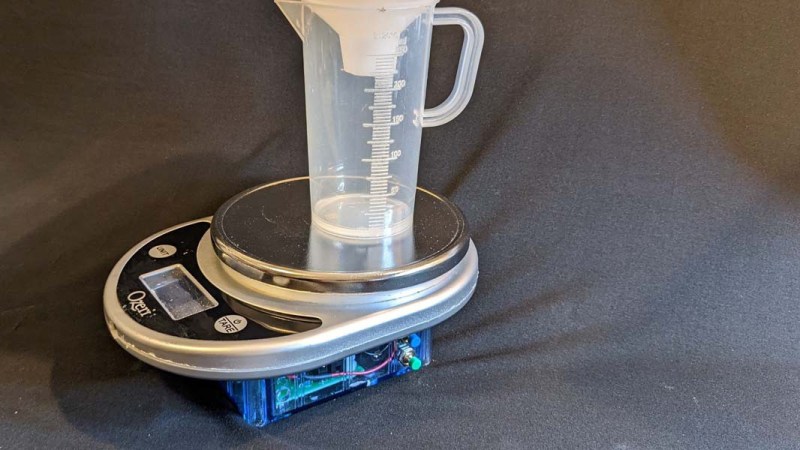
 For the hardware, [Jerry] took a small digital scale of a certain model and reused its load cell-based weighing mechanism using an HX711 amplifier, replacing the screen and adding an extra box for control electronics. With an Arduino MKR1010 as brains of the operation, the hardware’s there to log flow data, initially recorded onto the SD card, with WiFi connectivity to transfer the data to a computer for plotting; a DS3234 RTC breakout helps keep track of the time, and a custom PCB ties all of these together. All of these things are easy to put together, in no small part due to the extensive instructions provided.
If the topic feels familiar, it’s because we’ve covered a different device with the same purpose a few years ago. Seeing hackers take matters into their own hands when it comes to medical devices is endearing. It’s not just about the price and often, quality – there’s entire countries where medical tech availability is a problem, and open-source technology can have an outsized impact in such places. Even in technologically advanced countries, there’s big gaps when it comes to personal-use medical technology – for instance, we’ve seen effort upon effort by hackers building artificial pancreas solutions for diabetes management, a problem long overdue to be addressed by companies in the field. For those of us without chronic conditions, there’s still benefits to monitoring our health – hacking existing fitness trackers or building our own to learn more about how our bodies function.


They just collected it in the hospital, and measure it, I think by inch.
250mL seems way too small, didn’t Mythbusters find that 1L or more is not uncommon?
They may have, but I know a few urologists who would argue whether that’s healthy. If a person has any kidney reflux issues, bladder or kidney stones, emptying issues (like BPH), recurrent infections, or a bunch of other issues, doctors would probably recommend they empty way more often.
Isn’t it more about time than volume? I’m under the impression that holding for too long repetitively is what causes infections.
That said, when I was a child, I would hold it for entire school days almost every time since the school bathrooms were dirty and stinky. Never got an infection from that, maybe I’m just really lucky.
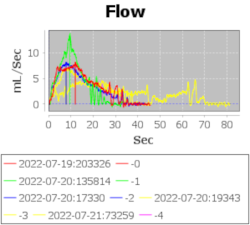
Yes, time is important. It involves charting the mass of the miction over time. Men with BPH can have an erratic urine flow so seeing the mass v. time relationship helps with the diagnosis.
DAMHIKT
Not according to my anatomy and physiology book. Average is 300 – 600 ml. With a liter doctors speak of urinary retention.
Pro tip: don’t get medical information from Mythbusters.
* Measuring cup
* Wristwatch
* Pen
* Paper
that’s only average flow rate measurement, and my understanding that existing medical devices also do continuous flow rate. I assume that’s for a reason!
Okay then, measuring cup, cell phone camera.
..and then sit down and rewatch the video, transcribing the rate yourself? or perhaps.. write an application that does it for you? =D yeah I’d rather hook a HX711 up to an off-the-shelf scale and use Jerry’s setup, it’s seriously impressively documented and repeatable!
Yes – the journal article referenced in the PDF (https://pubmed.ncbi.nlm.nih.gov/15655566/_ clarifies that peak flow correlates to symptom scores, but average flow does not. This project measures the peak flow rate. Actually, the main output of the project is the histogram graph showing the distribution of the automatically detected maximum flow for each week. Since the peak flow rate varies quite a bit. I think that these histogram graphs allow better visualization gradual changes in the condition.
You must have more hands than I…
[Snort!]
Works for some issues, but not all of them. And since flow rate isn’t linear or even quadratic (see the graph in the post) simple estimation isn’t accurate enough. Even just 75mL over the first 30 seconds (estimate based on the graph) can still provide some diagnostic information.
Was replying to “I Alone Possess The Truth”, and one of these days I’ll figure out which scripts and frames I need to let past uMatrix to keep replies in the right order.
“Smart” scales are already a thing in coffee-land. https://www.youtube.com/watch?v=SIzFhnZ32Y0
So, the device that measures “input” i.e. coffee, can also measure the “output”.
B^)
I have some questions:
1. This device measures weight. During the process of sample collection, you won’t only know the mass rate. Then, you’ll input the collected volume by hand, and only then you can convert from mass rate to flow rate.
2. Won’t the force of the incoming stream affect the mass rate measurement? I can exert a fair amount of force with my own… stream… That would be misinterpreted as a higher mass rate. I think the best way is to use some funnel contraption so you can redirect the stream in such a way that the impact is diverted 90 degrees from the measurement axis (vertical axis).
But maybe the second effect is negligible…
1. I don’t fully understand your comment. The system measures weight=volume (1gm / mL), then computes the flow rate as the time derivative of the volume.The system allows correcting the final measured volume based on visual measurement from the graduated beaker and will recompute the flow rate based on this corrected volume if necessary, but I don’t find that volume corrections are needed. The visual measurement just provides a check on the strain gauge measurement.
2. I’ve wondered about this question also. If the velocity of the fluid hitting the receptacle added an extra force, then when a uniform flow is applied and then suddenly stopped, the final volume showing after the flow stopped would be slightly lower than the volume showing just before it stopped. From records of the validation protocol, any such change is below the level of noise in the system (well below 1mL = 1g-force) so it is insignificant. [Since we know the flow rate and can easily estimate the velocity, it would be nice to see an analysis demonstrating that the velocity effect is insignificant, using F = dp/dt (where p is momemtum), or F = d(mv)/dt = dm/dt*v + m*dv/dt. Unfortunately, I get bogged down in the second term.]
What you are true measuring is mass rate of a fluid with an unknown density. Healthy urine density has a 1.003-1.030 g/mL, which on a 1 liter sample means 27g of difference. Enough to alter the Qmax results in my opinion. So the 1 g/mL assumption is wrong: You only truly know the density of the fluid after the collection has ended. Perhaps you can implement a a beaker with an overflow detector in such a way that you can link weight and volume, and automatically work out the density. Or input them after visual inspection, derive the flow rate and get the Qmax value.
The second point is just me being picky. But I would say that I can exert a significant force with my own stream. If you finally determine that stream forces are problematic, perhaps an embedded deflector that absorbs the impact force can eliminate the issue.