Weather In Wartime: The Importance Of British Meteorology In WWII

Weather can have a significant impact on transport and operations of all kinds, especially those at sea or in the air. This makes it a deeply important field of study, particularly in wartime. If you’re at all curious about how this kind of information was gathered and handled in the days before satellites and computer models, this write-up on WWII meteorology is sure to pique your interest.

Weather conditions were valuable data, and weather forecasts even more so. Both required data, which relied on human operators for instruments to be read and their readings transmitted.

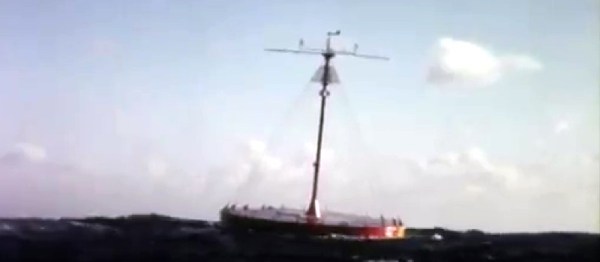
The main method of learning weather conditions over the oceans is to persuade merchant ships to report their observations regularly. This is true even today, but these days we also have the benefit of things like satellite technology. Back in the mid-1900s there was no such thing, and the outbreak of WWII (including the classification of weather data as secret information due to its value) meant that new solutions were needed.

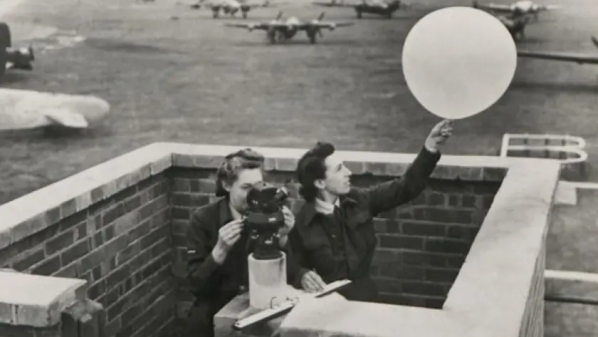
The aircraft of the Royal Air Force (RAF) were particularly in need of accurate data, and there was little to no understanding of the upper atmosphere at the time. Eventually, aircraft flew regular 10-hour sorties, logging detailed readings that served to provide data about weather conditions across the Atlantic. Readings were logged, encoded with one-time pad (OTP) encryption, then radioed back to base where charts would be created and updated every few hours.

The value of accurate data and precise understanding of conditions and how they could change was grimly illustrated in a disaster called the Night of the Big Wind (March 24-25, 1944). Forecasts predicted winds no stronger than 45 mph, but Allied bombers sent to Berlin were torn apart when they encountered winds in excess of 120 mph, leading to the loss of 72 aircraft.

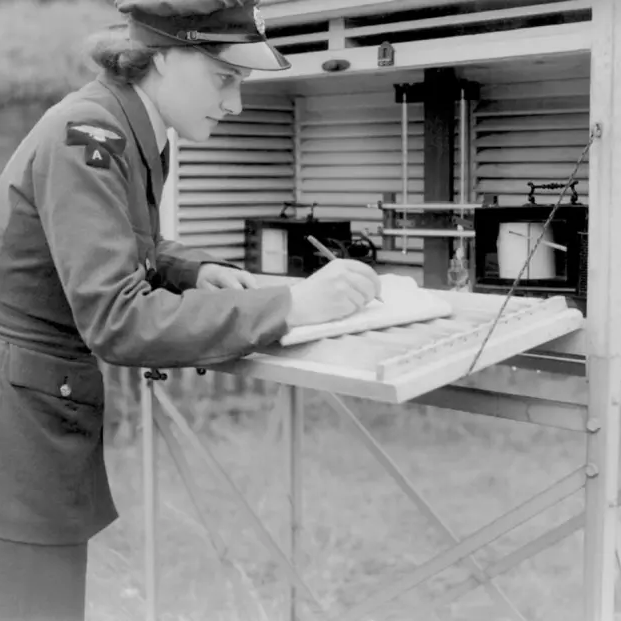
The types of data recorded to monitor and model weather are nearly identical to those in modern weather stations. The main difference is that instruments used to be read and monitored by human beings, whereas today we can rely more on electronic readings and transmission that need no human intervention.

Know Snow: Monitoring Snowpack With The SNOTEL Network

With summer just underway here in North America, it may seem like a strange time to talk about snow. But when you live in North Idaho, winter is never very far away and is always very much on everyone’s mind. Our summers are fierce but all too brief, so starting around September, most of us begin to cast a wary eye at the peaks of the Bitterroot range in the mornings, looking for the first signs of snow. And in the late spring, we do much the same, except longingly looking for the first signs that the snowpack is finally breaking up.

We all know how important snow is, of course. Snow is our lifeline, nearly the only source of drinking water we have here, as well as the foundation of our outdoor recreation industries. We also know that the snowpack determines our risk for wildfires, so while the long, dark winters may take a psychological toll, the longer the snow stays on the mountains, the less chance we have of burning come summer.

These are all very subjective measures, though, and there’s way too much riding on the snowpack to leave it up to casual observation. To make things more quantitative, the US Department of Agriculture’s Natural Resources Conservation Service (NRCS) has built a system across the western US that measures the snowpack in real-time, and provides invaluable data to climatologists, fish and game managers, farmers, and even the recreation industry, all of whom have a vested interest in the water held within. The network is called SNOTEL, and I recently got a chance to take a field trip with a hydrologist and get an up-close look at how it works.

Continue reading “Know Snow: Monitoring Snowpack With The SNOTEL Network”

Retrotechtacular: An Oceanographic Data Station Buoy For The 1960s

When we watch a TV weather report such as the ones that plaster our screens during hurricane season, it is easy to forget the scale of the achievement they represent in terms of data collection and interpretation. Huge amounts of data from a diverse array of sources feed weather models running on some of our most powerful computers, and though they don’t always forecast with complete accuracy we have become used to their getting it right often enough to be trustworthy.

It is also easy to forget that such advanced technology and the vast array of data behind it are relatively recent developments. In the middle of the twentieth century the bulk of meteorological data came from hand-recorded human observations, and meteorologists were dispatched to far-flung corners of the globe to record them. There were still significant areas of meteorological science that were closed books, and through the 1957 International Geophysical Year there was a concerted worldwide effort to close that gap.

We take for granted that many environmental readings are now taken automatically, and indeed most of us could produce an automated suite of meteorological instruments relatively easily using a microcontroller and a few sensors. In the International Geophysical Year era though this technology was still very much in its infancy, and the film below the break details the development through the early 1960s of one of the first automated remote ocean sensor buoys.

Perhaps our last sentence conjures up a vision of something small enough to hold, from all those National Geographic images of intrepid oilskin-clad scientists launching them from the decks of research vessels. But the technology of the early 1960s required something a little more substantial, so the buoy in question is a (using the units of the day) 100 ton circular platform more in the scale of a medium-sized boat. Above deck it was dominated by an HF (shortwave) discone antenna and its atmospheric instrument package. Below deck (aside from its electronic payload) it had a propane-powered internal combustion engine and generator to periodically charge its batteries. In use it would be anchored to the sea floor, and it was designed to operate even in the roughest of maritime conditions.

The film introduces the project, then looks at the design of a hull suitable for the extreme conditions like a hurricane. We see the first prototype being installed off the Florida coast in late 1964, and follow its progress through Hurricane Betsy in 1965. The mobile monitoring station in a converted passenger bus is shown in the heart of the foul weather, receiving constant telemetry from the buoy through 40 foot waves and 110 mph gusts of wind.

We are then shown the 1967 second prototype intended to be moored in the Pacific, this time equipped with a computerised data logging system. A DEC PDP-8 receives the data mounted in the bus, and are told that this buoy can store 24 hours at a stretch for transmission in one go. Top marks to the film production team for use of the word “data” in the plural.

Finally we’re told how a future network of the buoys for presumably the late 1960s and early 1970s could be served by a chain of receiving stations for near-complete coverage of the major oceans. At the height of the Cold War this aspect of the project would have been extremely important, as up-to-the-minute meteorological readings would have had considerable military value.

The film makes an engaging look at a technology few of us will ever come directly into contact with but the benefits of which we will all feel every time we see a TV weather forecast.

Continue reading “Retrotechtacular: An Oceanographic Data Station Buoy For The 1960s”