Professional mountain bike racing is a rather bizarre sport. At the highest level, times between podiums will be less than a second, and countless hours of training and engineering go into those fractions of seconds. An all too important tool for the world cup race team is data acquisition systems (DAQ). In the right hands, they can offer an unparalleled suspension tune for a world cup racer. Sadly DAQs can cost thousands of dollars, so [sghctoma] built one using little more then potentiometer and LEGO.
The hardware is a fairly simple task to solve. A simple Raspberry Pi Pico setup is used to capture potentiometer data. By some simple LEGO linkage and mounts, this data is correlated to the bikes’ wheel travel. Finally, everything is logged onto an SD card in a CSV format. Some buttons and a small AMOLED provide a simple user interface wrapped in a 3D printed case.
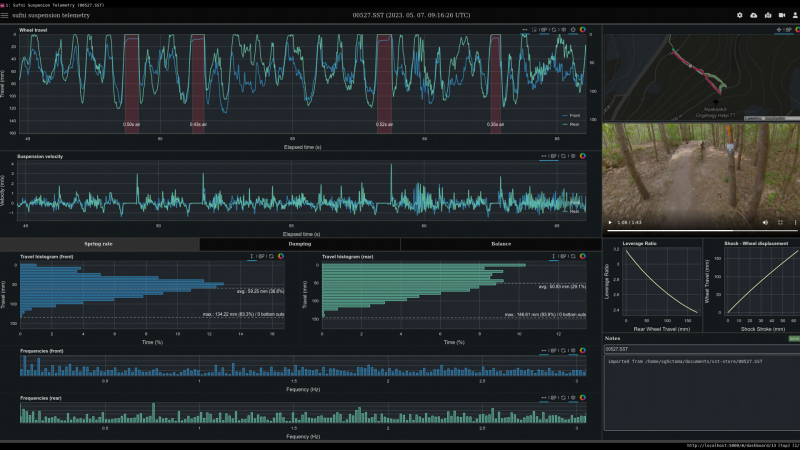
Analyzing the data is a rather daunting task. The entire analysis framework is neatly wrapped into a web server. The DAQ can automatically sync with the web interface, and provide suspension metrics in conjunction with action camera footage and a GPS track for further analysis.
However, not all is as it seems when it comes to correlating the suspension data into such a nice UI. A key issue is that with four bar, or even six bar, mountain bike linkage designs, the leverage ratio applied to the shock changes through the wheels travel. That means, when measuring shock travel, it needs to be adjusted to find wheel travel according to manufacturer specifications.
You need to be a bit of a suspension wizard to make sense of the charts. Nevertheless, for the mountain biking hackers out there, everything is available on Github, so if you wish to analyze suspension performance, make sure to check it out!
This isn’t the first time we have seen mountain bike data loggers, make sure to check out this simple Arduino build next!


Wire up the human into this and see how well of a “motor” they are?
Not relevant in MTB. They go downhill all the time.
MTB != Downhill
Why do they have all those low gears then!
to go up for the prize, which is the downhill ride :o)
There are pedals with force sensors. However I am riding E-MTB, and the crank of my bike can measure human power input.
Initially this project looked as something I was searching a while ago, but unfortunately it is not.
I am looking for a system which records the track (visually, cartographic and sensorial) so I can automatically log and classify routes for new (non existent) MTB tracks. Most MTB tracks in my region are poorly mapped and without any difficulty level and also no visual feedback which makes it hard for planning. Online services like Komoot and others are still very bad. Manually adding routes is a hazzle. The accuracy of pure GPS in a woody environment is just too bad.
There’s plenty of pedals among the clergy too, doesn’t make it much better in the long term.
while doing openstreetmap, I learned that GPS actually require a lot of time to get proper fix(not just ok I see 30satelites), there is a lot you can try to make it as accurate as you can, from hw to sw tricks. take a look at openstreetmap and dig more, they have lot of good articles about it https://wiki.openstreetmap.org/wiki/Recording_GPS_tracks
I did some openstreetmap too. However as stated, in a woody environment the accuracy is not good enough for this. Also the update rate of most receivers is too bad for recording fast changing movements. That’s why I thought of something like a visually assisted GPS. The visual (and maybe sensorial) part would be good for classyfing the difficulty of the track too. So newbies can estimate the difficulty in the planning stage.
I may do a test with the new UM981S module which offers 50Hz update rate by combining an inertial navigation system. The RTK will not be of great help.
I have a BSC200 computer, GPS working very well(compared to Android devices), even in the woods.
Others report other: https://old.reddit.com/r/cycling/comments/16oat43/igpsport_cycling_gps_bsc200_bsc300/lb6pv06/
It’s only pseudo accuracy which goes for cycling on known roads based on existent map data and interpolation, not for MTB. Actual track recordings have very low accuracy. S-Curves with 3m radius are becoming a straight line.
I tried making something like this by tying 3 axis accelerometers onto the front and rear right beside the axles, another on the frame, to try to characterize damping and rebound, and learned a lot about vibration and how poorly SPI and I2C do over meter-long cabling. But yeah, trying to tune by “eh, that feels better” isn’t great. We can set sag algorithmically but all the rest needs instrumentation.
I was thinking that would be a reasonably effective way of building one. How well did it work?
I made somthing similar on robotic suspensions with cheap linear sensor :https://www.alibaba.com/product-detail/Linear-Potentiometer-Position-with-Rod-End_1601198325961.html
Work really well for the price with “phidget ADC” and melee computer.