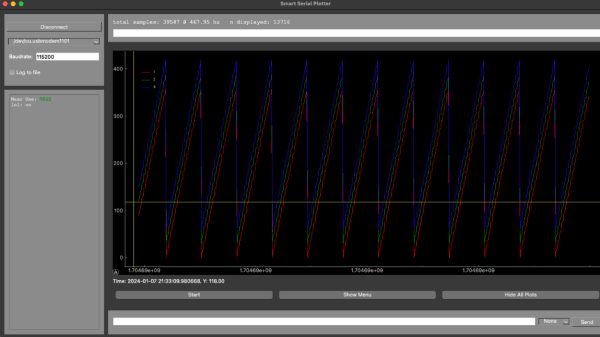
When you’re working with a development team, especially in a supporting capacity, you can often find yourself having to invent tools and support systems that are fairly involved, but don’t add to the system’s functionality. Still, without them, it’d be a dead duck. [Aidan Chandra] was clearly in a similar situation, working with a bunch of postgrads at Stanford, on an exoskeleton project, and needed an accurate data plotter to watch measurements in real-time.
This particular problem has been solved many times over, but [Aidan] laments that many solutions available seem to be too complex, hard to extend, or just have broken dependencies. This happens a lot, and it simply leads to yet another project to get going, before you can do the real work it supports. Based on Python and PyQT5, serial-plotter is a new beginning, with an emphasis on correct data acquisition and real-time data visualization with a little processing thrown in. Think, acquire data, show the raw values as well as the mean value, and RMS noise all on the same windows side-by-side, all of which is easily tweakable with a bit of programming using Numpy and Matplotlib.
One particularly important point to highlight is that of the handling of time-stamping. [Aidan] needed to ensure samples were logged together with a local MCU timestamp so that when displayed and possibly later post-processed, it was possible to accurately determine when a particular value or event occurred. With the amount of buffering, data loss and multiple-thread shenanigans, it is easy to forget that the data might get to the application in a non-deterministic way, and just relying on local CPU time is not so useful.
If you need to visualize data transported over the serial port, we have seen many projects to help. Like the highly configurable Serial Studio, for one. If your needs are a bit more complex, especially with multiple data transport methods, then a Supercon 2022 talk by [Alex Whittemore] might be a jolly good place to start.


