Hacking High School Exams And Foiling Them With Statistics

graph

A few weeks ago, [Debarghya Das] had two friends eagerly awaiting the results of their High School exit exams, the ISC national examination, taken by 65,000 12th graders in India. This exam is vitally important for each student’s future; a few points determines which university will accept you and which will reject you. One of [Debraghya]’s friends was a little anxious about his grade and asked if it was possible to hack into the board of education’s servers to see the grades before they were posted. [Debraghya] did just that, and was able to download the exam records of nearly every student that took the test.. Looking even closer at the data, he also found evidence these grades were changed in some way.

Getting the grades off the CISCE board of education’s servers was very simple; each school has a separate code, and each student is given an individual number. With the simplest javascript magic, [Debraghya] discovered that individual grades could be accessed by pointing a script to /[4 digit school ID]/[3 digit student ID] on the CISCE server. There was absolutely no security here, an impressive oversight indeed.

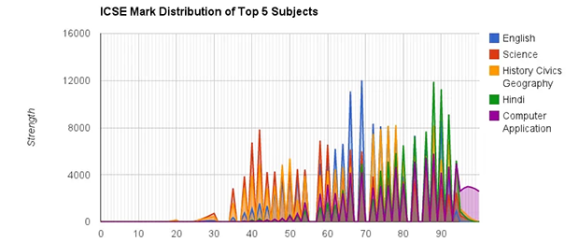
After writing a small script and running it on a few machines, [Debraghya] had the exam results, names, and national IDs of 65,000 students. Taking a closer look at the data, he plotted all the scores and came up with a very strange-looking graph (seen above). It looked like a hedgehog, when nearly any test with a population this large should be a continuous curve.

[Debraghya] is convinced he’s discovered evidence of grade tampering. Nearly a third of all possible scores aren’t represented in the data, but scores from 94 to 100 are accounted for, making the hedgehog shape of the graph statistically impossible. Of course [Debraghya] only has the raw scores, and doesn’t know exactly how the tests were scored or how they were manipulated. He does know the scores were altered, though, either through normalizing the raw scores or something stranger and more sinister.

While scraping data off an unencrypted server isn’t much of a hack, despite what the news will tell you, we’re awfully impressed with [Debraghya]’s analysis of the data and his ability to blow the whistle and put this data out in the open. Without any information on how these scores were changed, it doesn’t really change anything, and we’ll welcome any speculation in the comments.

Microcontroller Statistics With A Small SRAM Footprint

statistics-library-for-microcontrollers

You may know your way around the registers of that favorite microcontroller, but at some point you’ll also need to wield some ninja-level math skills to manage arrays of data on a small device. [Scott Daniels] has some help for you in this arena. He explains how to manage statistical calculations on your collected data without eating up all the RAM. The library which he made available is targeted for the Arduino. But the concepts, which he explains quite well, should be easy to port to your preferred hardware.

The situation he outlines in the beginning his post is data collected from a sensor, but acted upon by the collection device (as opposed to a data logger where you dump the saved numbers and use a computer for the heavy lifting). This can take the form of a touch sensor, which are known for having a lot of noise when looking at individual readings. But since [Scott] is using the Mean and Standard Deviation to keep running totals of collected data over time it is also very useful for applications like building your own home heating thermostat.

Investigating The Strength Of The 4-digit PIN

If we wanted to take a look at the statistics behind 4-digit pin numbers how could we do such a thing? After all, it’s not like people are just going to tell you the code they like to use. It turns out the databases of leaked passwords that have been floating around the Internet are the perfect source for a little study like this one. One such source was filtered for passwords that were exactly four digits long and contained only numbers. The result was a set of 3.4 million PIN numbers which were analysed for statistical patterns.

As the cliché movie joke tells us, 1234 is by far the most commonly used PIN to tune of 10% (*facepalm*). That’s followed relatively closely by 1111. But if plain old frequency were as deep as this look went it would make for boring reading. You’ll want to keep going with this article, which then looks into issues like ease of entry; 2580 is straight down the center of a telephone keypad. Dates are also very common, which greatly limits what the first and last pair of the PIN combination might be.

We’ll leave you with this nugget: Over 25% of all PINs are made of just 20 different number (at least from this data set).

[Thanks Awjlogan]

Measuring The Speed Of Sound With Science And Statistics

Despite what you may have heard elsewhere, science isn’t just reading [Neil deGrasse Tyson]’s Twitter account or an epistemology predicated on the non-existence of god. No, science requires much more work watching Cosmos, as evidenced by [Ast]’s adventures in analyzing data to measure the speed of sound with a microcontroller.

After [Ast] built a time to digital converter – basically an oversized stopwatch with microsecond resolution – he needed a project to show off what his TDC could do. The speed of sound seemed like a reasonable thing to measure, so [Ast] connected a pair of microphones and amplifiers to his gigantic stopwatch. After separating the microphones by a measured distance; [Ast] clapped his hands, recorded the time of flight for the sound between the two microphones, and repeated the test.

When the testing was finished, [Ast] had a set of data that recorded the time it took the sound of a hand clap to travel between each microphone. A simple linear regression (with some unit conversions), showed the speed of sound to be 345 +/- 25 meters per second, a 7% margin of error.

A 7% margin of error isn’t great, so [Ast] decided to bring out Numpy to analyze the data. In the first analysis, each data point was treated with equal weight, meaning an outlier in the data will create huge errors. By calculating the standard deviation of each distance measurement the error is reduced and the speed of sound becomes 331 +/- 14 m/s.

This result was better, but there were still a few extraneous data points. [Ast] chalked these up to echos and room vibrations and after careful consideration, threw these data points out. The final result? 343 +/- 9 meters per second, or an error of 2.6%.

A lot of work for something you can just look up on Wikipedia? Yeah, but that’s not science, is it?

Penny Auction Hacking; Put On Your Statistician’s Hat

Penny auctions are where you must pay a fee each time you bid. Certainly this alters the behavior of the bidders, but there doesn’t seem to be a lot of info about exactly how. In preparation for an analytics degree, [Jay] decided to study penny auctions and see if he can win a contest based on his findings. Now he’s not necessarily looking to make a living by gaming the auction system. But we were interested to see how he went about getting information, and what he has to say about the results.

Since there really isn’t a large body of data available, he scraped it himself. You’ll want to page through his posts on the topic, but basically he’s using Python on a fast machine. This is made quite a bit easier through the use of Selenium RC, but it also means he’s got a lot of instances of Firefox running to track multiple auctions. Scraped data is stored in CSV files, and posted to his front page daily.

From what he’s captured so far [Jay] suggests that time of day, type of auction, and several other factors dictate when you should bid to attain the best deals.