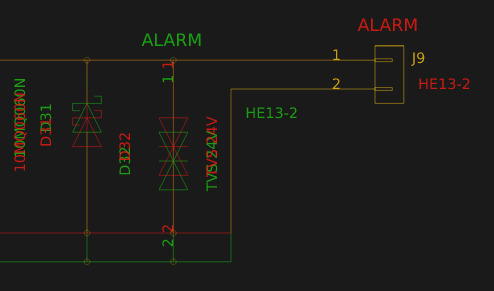
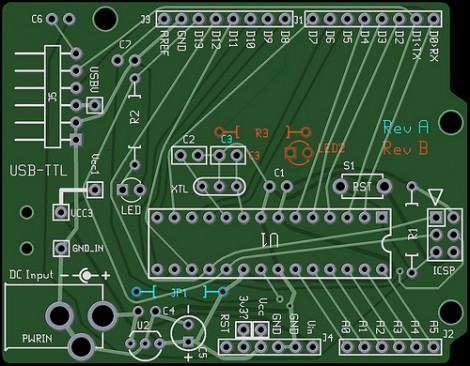
When writing software a key part of the development workflow is looking at changes between files. With version control systems this process can get pretty advanced, letting you see changes between arbitrary files and slices in time. Tooling exists to do this visually in the world of EDA tools but it hasn’t really trickled all the way down to the free hobbyist level yet. But thanks to open and well understood file formats [jean-noël] has written plotgitsch to do it for KiCAD.
In the high(er)-end world of EDA tools like OrCAD and Altium there is a tight integration between the version control system and the design tools, with the VCS is sold as a product to improve the design workflow. But KiCAD doesn’t try to force a version control system on the user so it doesn’t really make sense to bake VCS related tools in directly. You can manage changes in KiCAD projects with git but as [jean-noël] notes reading Git’s textual description of changed X/Y coordinates and paths to library files is much more useful for a computer than for a human. It basically sucks to use. What you really need is a diff tool that can show the user what changed between two versions instead of describe it. And that’s what plotgitsch provides.
plotgitsch’s core function is to generate images of a KiCAD project at arbitrary Git revisions. After that there are two ways to view the output. One is to generate images of each version which can be fed into a generic visual diff tool (UNIX philosophy anyone?). The documentation has an example script to help facilitate setting this up. The other way generates a color coded image in plotgitsch itself and opens it in the user’s viewer of choice. It may not be integrated into the EDA but we’ll take one click visual diffs any day!


