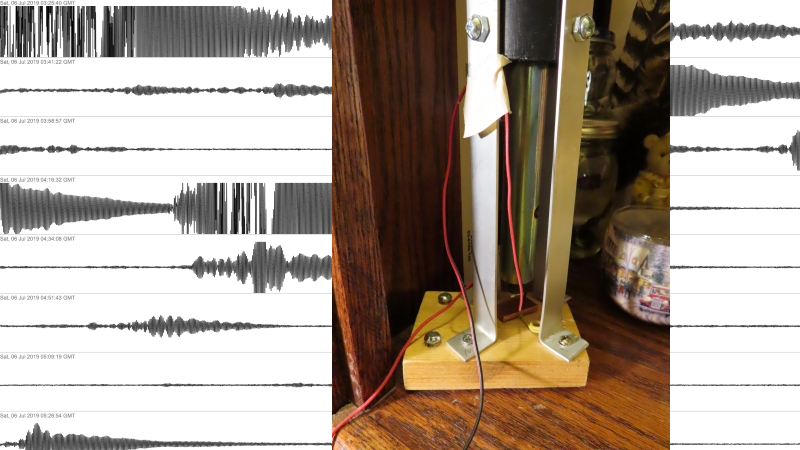
When an earthquake strikes, it’s usually hard to miss. At least that’s the case with the big ones; the dozens or hundreds of little quakes that go largely unnoticed every day are interesting too, and make sense to track. That’s usually left to the professionals, with racks of sensitive equipment and a far-flung network of seismic sensors. That doesn’t mean you can’t keep track of doings below your feet yourself, with something like this DIY seismograph.
Technically, what [Alex] built is better called a “seismic detector” since it’s not calibrated in any way. It’s just a simple sensor for detecting ground vibrations, whether they be due to passing trucks or The Big One. [Alex] lives in California, wedged between the Hayward, Calaveras, and San Andreas faults in San Jose, so there is plenty of opportunity for testing his device. The business end is a simple pendulum sensor, with a heavy metal bob hanging from a long wire inside a length of plastic pipe. Positioned close to the bob is a copper plate; the bob and the plate form an air-dielectric variable capacitor that controls the frequency of a simple 555 oscillator. The frequency is measured by a PIC microcontroller and sent to a Raspberry Pi, which displays the data on a graph. You can check in on real-time seismic activity in San Jose using the link above, or check out historical quakes, like the 7.1 magnitude Ridgecrest quake in July. [Alex]’s sensor is sensitive enough to pick up recent quakes in Peru, Fiji, and Nevada, and he even has some examples of visualizing the Earth’s core using data from the sensor. How cool is that?
We’ve seen other seismic detectors before, like this piezo-based device, or even one made from toilet parts. We like the simplicity of the capacitive sensor [Alex] used, though.


Could of used a . . . oh, nevermind, he did. Nice project.
And now for the, “you could have just done that with an Arduino,” comment.
You could have just done that with an Arduino. ;)
If I had the PIC, this seems like it would be an interesting project to put together at home.
Is the frequency from the 555 timers too high to use an inexpensive ADC to read?
This is a hell of a lot cheaper than the Raspberry Shake modules even it the calibrated data can’t be used for that project.
The ADC is not used at all – the PIC just counts the number of 555 oscillations for a fixed time interval and outputs this to the Raspberry PI GPIO.
Thanks for sharing, neat simple build with great detail.
Get’s me thinking how mechanically simple of mechanisms can be used and tuned for the range of VLF and lower… well… technically higher also geological events. Interesting is the change in electric field charge relating to tornado’s and wondering if there is anything similarly related in regards to electric or magnetic charge prior to, during and after other weather events.
Installs earthquake dectators on satellite cameras and telescopes that can see plate shifting after seeing into the ocean floor.