
At first glance, both the executables that a compiler produces, and the libraries that are used during the building process seem like they’re not very accessible. They are these black boxes that make an application go, or make the linker happy when you hand it the ‘right’ library file. There is also a lot to be said for not digging too deeply into either, as normally things will Just Work™ without having to bother with such additional details.
The thing is that both executables and libraries contain a lot of information that normally is just used by the OS, toolchain, debuggers and similar tools. Whether these files are in Windows PE format, old-school Linux a.out or modern-day .elf, when things go south during development, sometimes one has to break out the right tools to inspect them in order to make sense of what is happening.
This article will focus primarily on the Linux platform, though most of it also applies to BSD and MacOS, and to some extent Windows.
Opening the Black Box
Regardless of which platform you’re on, executable and library formats all have a number of common sections. There is of course the section with the actual instructions, as well as the section with all of the text strings and constant values that we put in the code before we compiled it. If we instructed the compiler to generate debug symbols and told the linker to leave those in place, we also have the debug symbols included in its own section. We will look at those later in this article.
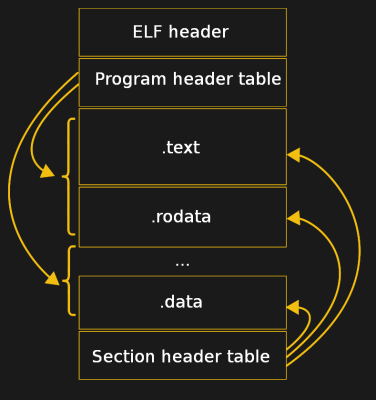
In the ELF (Executable and Linkable Format) that is commonly used on Linux and many other operating systems, the rough layout follows this diagram. Not all of these sections are required, and their inclusion depends on what options were selected when the executable file was created.
A quick overview of an executable file’s properties can be obtained with the file utility:
ELF 32-bit LSB shared object, Intel 80386, version 1 (GNU/Linux), dynamically linked, interpreter /lib/ld-linux.so.2, for GNU/Linux 3.2.0, BuildID[sha1]=0558c7ef0f6845826d012b4ccc14948a2ffe8277, stripped
This output tells us that we’re dealing with a 32-bit binary, compiled for the x86 architecture, which uses a number of shared libraries, and which has had its debug symbols stripped.
If debug symbols are still present, we get:
ELF 32-bit LSB shared object, Intel 80386, version 1 (GNU/Linux), dynamically linked, interpreter /lib/ld-linux.so.2, for GNU/Linux 3.2.0, BuildID[sha1]=0558c7ef0f6845826d012b4ccc14948a2ffe8277, with debug_info, not stripped
In this particular case, we are dealing with a binary that was compiled on Raspbian Buster for x86, which is a 32-bit version of Linux, so that all matches.
For a Windows executable file we get the following, less expansive output:
PE32+ executable (GUI) x86-64, for MS Windows
This tells us that we are dealing with a PE (Windows) executable, compiled for the 64-bit x86-64 architecture.
As one may have guessed at this point, libraries, both dynamic and shared, use the same format as the executables, so for example examining an .so shared library file on Linux would generate almost the same output when we use the file command.
Sharing Responsibly
Unique to (desktop) operating systems is the ability to load dynamic (shared) libraries when the application is started. Here the assumption is made that the required libraries are present on the host system, and in the search path for the library loader (an OS component). Libraries can also be versioned to indicate different revisions. This usually happens via the filename, with the generic name (e.g. libfoo.so) symlinked to the actual file (libfoo.so.0.1). If there’s a mismatch with the version, this can result in a symbol error, which we’ll look at in the next section.
When an executable uses shared library files, it is easy to check which direct dependencies (encoded in the executable file) it uses, by checking the executable with the ldd utility, which has a gotcha that it does not work well with the older a.out format. This isn’t really an issue with modern day development on Windows, Linux/BSD, and MacOS, which use the PE (PE32+), ELF and Mach-O formats, respectively. For embedded development (e.g. ARM Cortex-M) the ELF format is also used as an intermediary format before generating the binary image.
Listing Dependencies
The basic output from ldd shows where direct dependencies are found on the filesystem, and which dependencies are not found. For example, this is the (heavily) abbreviated output from ldd for ffplay.exe under MSYS2 on Windows:
$ ldd /mingw64/bin/ffplay.exe
        ntdll.dll => /c/Windows/SYSTEM32/ntdll.dll (0x77780000)
        kernel32.dll => /c/Windows/system32/kernel32.dll (0x77660000)
        KERNELBASE.dll => /c/Windows/system32/KERNELBASE.dll (0x7fefd730000)
        msvcrt.dll => /c/Windows/system32/msvcrt.dll (0x7fefed80000)
        SHELL32.dll => /c/Windows/system32/SHELL32.dll (0x7fefdab0000)
        SHLWAPI.dll => /c/Windows/system32/SHLWAPI.dll (0x7fefda10000)
        GDI32.dll => /c/Windows/system32/GDI32.dll (0x7feff0e0000)
        USER32.dll => /c/Windows/system32/USER32.dll (0x77560000)
        LPK.dll => /c/Windows/system32/LPK.dll (0x7fefeb30000)
        USP10.dll => /c/Windows/system32/USP10.dll (0x7feff6e0000)
        SDL2.dll => /mingw64/bin/SDL2.dll (0x644c0000)
        [...]
Dependencies shown for the average executable can be pretty massive (the full list is about eight times this length), but it’s useful as a quick sanity check to see not only whether a dependency has been fulfilled, but also whether the application loader has picked the right library. It can happen for example that a system has two different versions of a library (e.g. in /usr/shared/bin and /usr/bin), which can lead to the hilarious situation where you spend half a day debugging different libraries and application versions, rolling back ‘known working’ code versions and losing your sanity.
Another thing which a tool like ldd shows is at which address the library has been loaded, but that’s useful only for truly advanced levels of debugging and optimization.
When Symbols Go AWOL
Things get fun when we talk about symbols in the context of executable and library formats. This is not about debug symbols, which are a completely different topic, but the symbols that are integral to making it possible for sections of code to be found, whether while executing, or while linking object files and static libraries together. Missing symbols lead to fun run-time errors as well, where an ‘entry point’ is not found in some shared library.
A quick way to fix such issues is usually to ensure that you have the matching versions of the libraries for the code or executable file. Sometimes this all checks out, and the application loader or linker tool is still giving you lip about missing symbols, so what gives?
 In the case of linking code, it can be as simple as the wrong linking order, as toolchains for most languages use an opportunistic linking style that remembers missing symbols, but does not remember symbols it has already seen. While in languages like Ada this is not an issue, in C-style languages, determining the linking order in the commands given to the linker tool is essential.
Another issue is where a language (like C++) supports overloading functions to support different arguments and return types, and name mangling is used (to get a unique symbol). If a header file was compiled in C++ mode, when it’s supposed to be linked against a library that was compiled as C code, without name mangling, this would make the linker tool give the ‘missing symbol’ error for those functions.
In order to figure out whether a missing symbol is truly missing, improperly mangled, left unmangled or in another library or object file, one can use a utility like readelf to check which symbols are actually in the file. Note that (obviously) readelf only supports ELF-style files. A more generic utility that focuses on just symbols in a variety of formats is nm. For example, this output from the Wikipedia entry on nm:
# nm test.o
0000000a T _Z15global_functioni
00000025 T _Z16global_function2v
00000004 b _ZL10static_var
00000000 t _ZL15static_functionv
00000004 d _ZL15static_var_init
00000008 b _ZZ15global_functioniE16local_static_var
00000008 d _ZZ15global_functioniE21local_static_var_init
         U __gxx_personality_v0
00000000 B global_var
00000000 D global_var_init
0000003b T main
00000036 T non_mangled_function
This shows what the output from nm looks like when a C++ compiler is used. Nm can be instructed to demangle symbols to make it easier to read if that’s necessary. Regardless, its output tells us whether a symbol exists in the file or is undefined (‘U’). It will also detail where the symbol is defined (which section) and what type of symbol it is (if relevant). In the above example we see one undefined symbol (‘U’), a couple of text (code) section symbols (‘T’ & ‘t’), one symbol in the uninitialized data section (BSS, ‘B’ & ‘b’) and two in the initialized data section (‘D’ & ‘d’).
Of these, we’d just need to hand the linker a library or object file that contains the one undefined symbol to make this code link and produce an executable.
Last Resort: Tracing Application Startup
Annoyingly, sometimes everything seems in order, yet the application fails to start, or quits half-way through with a mysterious message. This is where a utility like strace can be extremely useful, as it traces all system calls involving the application from the moment that the application starts. Often, the issue with an application not loading is due to an indirect dependency that cannot be loaded, an environmental setting that is inappropriate, or a file that was accidentally set to read-only.
Simply firing up strace with the application as argument will output a list of the system calls as made by the application, including errors, such as a missing file:
open("/foo/bar", O_RDONLY) = -1 ENOENT (No such file or directory)
Or a missing library dependency:
open("/usr/lib/libfoo.so", O_RDONLY|O_CLOEXEC) = -1 ENOENT (No such file or directory)
Wrapping Up
Obviously none of this is the end-all, be-all of debugging the linking and running of executables, binaries, and an assortment of related issues. As with so many things in life, in the end it’s mostly experience that counts. Over time one will develop an intuition for where the problem likely lies, as well as how to find out the culprit as quickly as possible.
Having spent many years in commercial software development and having survived a range of (overly) ambitious hobby projects, I can definitely say that there is a lot of knowledge that I wish I had had sooner. On the other hand, the act of discovering why some things were not working and correcting this injustice against the order of the world was usually rewarding in itself.
That said, one has to pick their battles wisely. Sometimes learning things from scratch isn’t worth it, and leaning on the knowledge of others is nothing to be ashamed of. Especially when it’s Friday afternoon and the client expects delivery of the new version on Monday. Hopefully this article has been helpful in that regard.


Only to say that a.out pre-dates Linux, or even Minix (remeber that?) but was on Unix, both 4.2 BSD and System V, and probably earlier Unices too.
Since 3BSD/VMUNIX in 1979, at least.
In case people are curious about how much information can be gotten out of a compiled binary, I recently wrote a fuzzer that uses debug information to infer the complete type system of a C language program and automatically generated API fuzzers for it. You can find it on GitHub here: https://github.com/intel/fffc
Is there any way readelf/nm could for example help solving stack overflows, or heap allocation problems?
Probably not, though if you try hard enough, it’s possible to contrive an example where they could be somewhat helpful.
Stack overflows and heap allocation problems are generally runtime problems, often caused by faults in the program logic, while readelf and nm are tools for displaying symbol table information that’s set at compile time.
The easiest example I can contrive where they could be useful is if you have two subroutines named “foo”, in different libraries, and your main program is calling “foo” with the expectation that it will behave like the “foo” you wrote in library A, but instead, you’re picking up a different “foo” from library B, and the difference in behavior between the two subroutines is what causes the stack overflow symptom.
For solving link problems, such as unresolved external references (or the problem I just described, where you want to know which version of a particular library routine your program is using), readelf/nm are good starting points. For solving stack overflows or heap corruption issues, an interactive symbolic debugger is usually the tool of choice to start with.