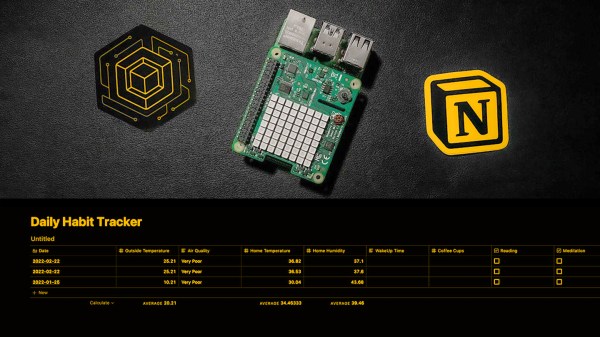
Recently, [Edward Schmitz] wrote in to let us know about his Hackaday.io project: SigCore UC: An Open-Source Universal I/O Controller With Relays, Analog I/O, and Modbus for the Raspberry Pi.
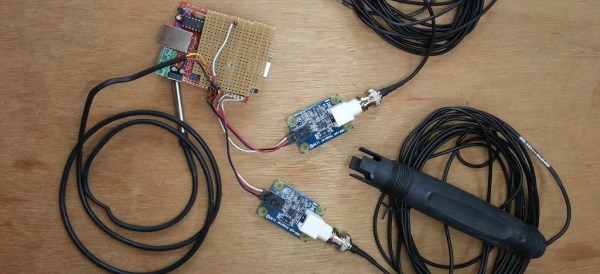
In the video embedded below, [Edward] runs us through some of the features which he explains are a complete industrial control and data collection system. Features include Ethernet, WiFi, and Modbus TCP connectivity, regulated 5 V bus, eight relays, eight digital inputs, four analog inputs, and four analog outputs. All packaged in rugged housing and ready for installation/deployment.
[Edward] says he wanted something which went beyond development boards and expansion modules that provided a complete and ready-to-deploy solution. If you’re interested in the hardware, firmware, or software, everything is available on the project’s GitHub page. Beyond the Hackaday.io article, the GitHub repo, the YouTube explainer video, there is even an entire website devoted to the project: sigcoreuc.com. Our hats off to [Edward], he really put a lot of polish on this project.
If you’re interested in using the Raspberry Pi for input/output you might also like to read about Raspberry Pi Pico Makes For Expeditious Input Device and Smart Power Strip Revived With Raspberry Pi.
Continue reading “SigCore UC: An Open-Source Universal I/O Controller For The Raspberry Pi”