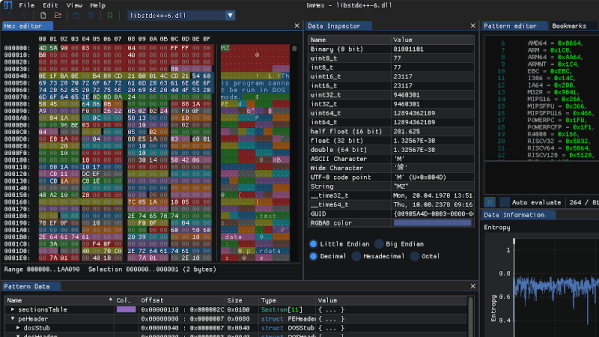
It’s little surprise that most hackers have a favorite text editor, since we tend to spend quite a bit of time staring at the thing. From writing code to reading config files, the hacker’s world is filled with seemingly infinite lines of ASCII. Comparatively, while a hex editor is a critical tool to have in your arsenal, many of us don’t use one often enough to have a clear favorite.
But we think that might change once you’ve taken ImHex for a spin. Developer [WerWolv] bills it specifically as the hex editor of choice for reverse engineering, it’s released under the GPL v2, and runs on Windows, Linux, and macOS. Oh, and did we mention it defaults to a slick dark theme designed to be easy on the eyes during those late night hacking sessions — just like your favorite website? Continue reading “ImHex: An Open Hex Editor For The Modern Hacker”→
Have you ever had to write a bit of code to interpret a non-linear analog reading as picked up by an ADC? When all you have to work with for your transfer function is a graph in a semiconductor datasheet that was probably written thirty years ago and prints out the size of a postage stamp, that’s a rather annoying task. Wouldn’t it be nice if you had access to the numbers behind the graph!
You can’t knock on the office door of the engineer who created it back in the ’80s, he’s probably in retirement and playing golf or growing prize petunias by now. But you can digitize the graph to get yourself a lot closer to the action, and to help you in your quest there’s a handy online tool.
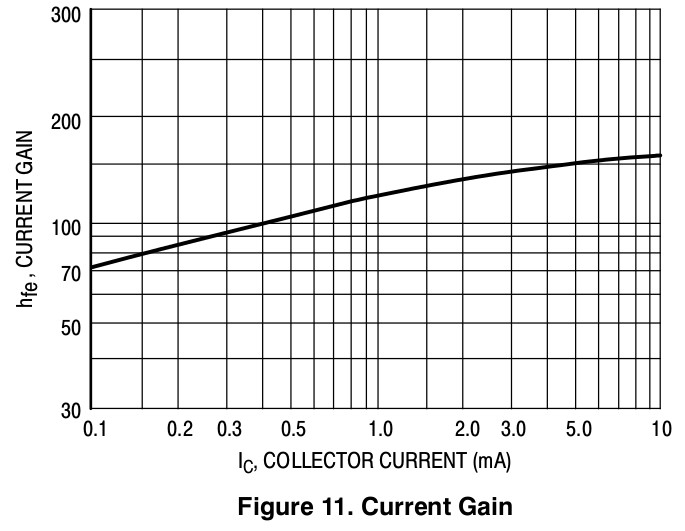
2N3904 current gain
WebPlotDigitizer is not new, it’s been around for quite a few years now. But it’s still worth talking about, because it’s one of those tools to keep in reserve. If you’ve ever needed it, you’ll know what we mean.
So how does it work? Load an image with a graph in it, select some points on the X and Y axis, roughly trace the curve with a marker tool, and set it in motion. Let’s give it a go. We’re going to try digitizing the current gain plot from the 2N3904 datasheet (PDF) that we examined a few days ago.
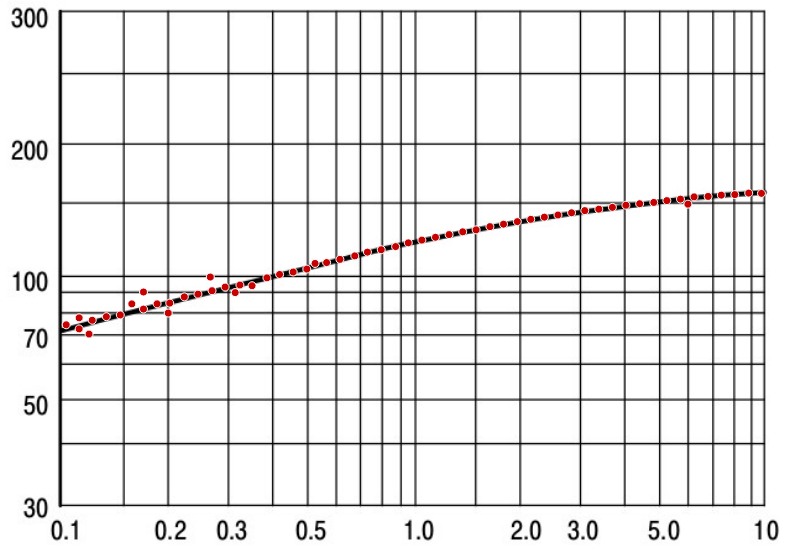
Data points!
So, open the WebPlotDigitizer app, load the graph image captured from the sheet as a JPEG. It asks what type of graph you’ve loaded, in this case a 2D X-Y plot. It asks you to identify four known points on the axes and supply their values. You also tell it if the axes are logarithmic at this point. Select “Automatic mode” on the right hand side, then click “Pen” and mark the graph trace, then select the colour of the trace. Click the “Run” button, and your data points appear. Hit the “View data” button, and there you have it. A few rogue points to remove perhaps, but it does a pretty good job.
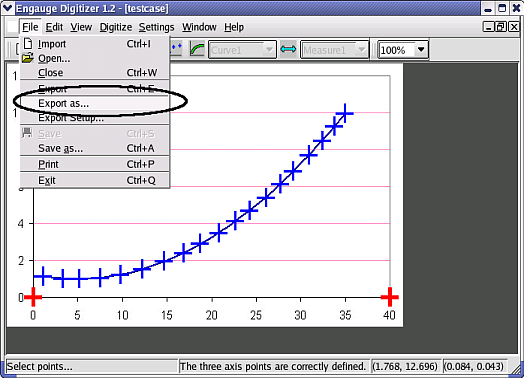
We’ve seen ’em before: the charts and graphs in poorly photocopied ’80s datasheets, ancient research papers, or even our college prof’s chalkboard chicken scratch. Sadly, this marvelously plotted data is locked away in a poorly rendered png or textbook graphic. Fortunately, a team of programmers have come the rescue to give us the proper thieving tool to lift that data directly from the source itself, and that tool is Engauge.
Engauge is an open source software tool that enables to convert pictures of plots into the numerical representation of their data. While some of us might still be tracing graphs by hand, Engauge enables us to simply define reference points on the graph, and a clever image-processing algorithm extracts the curve for us automatically! Sure, there’s a little fine-tuning to determine what counts as data, but the net result is an all-in-one software tool that eats pictures and produces data–no intermediate steps required!
Engauge has been helping scientists and engineers preserve ancient data logs for years now, but it’s a tool that’s still fresh today when we’re recording from an analog o’scope or lifting those xs and ys off a textbook. In a world that’s increasingly digital, we’ve got the Engague developers to thank for arming us with the right tool for the job. All that said, If graph-thieving isn’t your thing, try spline-thieving to go from camera to CAD.
Engauge is a little lacking in the demo-video department, but we dug up a quickie on YouTube.