Hacker Tactic: Internal ESD Diode Probing

Humans are walking high voltage generators, due to all the friction with our surroundings, wide variety of synthetic clothes, and the overall ever-present static charges. Our electronics are sensitive to electrostatic discharge (ESD), and often they’re sensitive in a way most infuriating – causing spurious errors and lockups. Is there a wacky error in your design that will repeat in the next batch, or did you just accidentally zap a GPIO? You wouldn’t know until you meticulously check the design, or maybe it’s possible for you to grab another board.

Thankfully, in modern-day Western climates and with modern tech, you are not likely to encounter ESD-caused problems, but they were way more prominent back in the day. For instance, older hackers will have stories of how FETs were more sensitive, and touching the gate pin mindlessly could kill the FET you’re working with. Now, we’ve fixed this problem, in large part because we have added ESD-protective diodes inside the active components most affected.

These diodes don’t just help against ESD – they’re a general safety measure for protecting IC and transistor pins, and they also might help avoid damaging IC pins if you mix. They also might lead to funny and unexpected results, like parts of your circuit powering when you don’t expect them to! However, there’s an awesome thing that not that many hackers know — they let you debug and repair your circuits in a way you might not have imagined.

Continue reading “Hacker Tactic: Internal ESD Diode Probing”

The Orbtrace debugger hardware connected to a development board t hrough a 20-pin ribbon cable. The development board has a green LED shining.

ORBTrace Effort: Open Tool For Professional Debugging

There are some fairly powerful debugging facilities available on today’s microcontrollers — if your code crashes mysteriously, chances are, there’s a debugging interface that could let you track down the exact crash circumstances in no time. Sadly, debugging tools for these powerful interfaces tend to be prohibitively expensive and highly proprietary, thus, not friendly for hobbyists. Now, there’s a community-driven high-capability debugging platform called ORBTrace, brought to us by [mubes] and [zyp].

With parallel trace, you get a constant stream of consciousness, every exact instruction executed by your CPU. [mubes] and [zyp] set out to tap into the power of parallel trace debugging for Cortex-M processors. and the ORBTrace project was born. Relying on the Orbuculum project’s software capabilities, this FPGA-based debugger platform can do parallel trace and the more popular high-speed SWO trace – and way more. ORBTrace has the potential to grow into a powerful debug helper tool, with enough capabilities for anyone to benefit. And of course, it’s fully open-source.

The ORBTrace board, with a FPGA in the center of it, a USB-C connector on the left, and two IDC debug connectors on the right (one ten-pin and one twenty-pin)
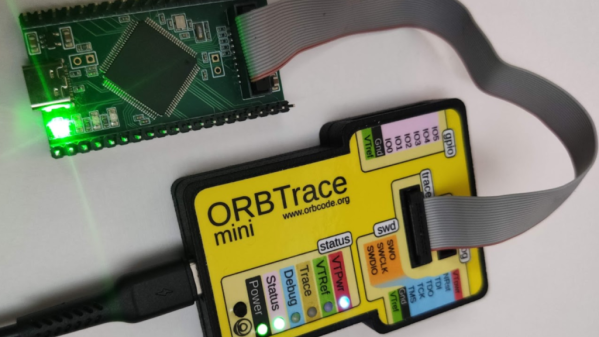
The ORBTrace platform has plenty of untapped potential. There’s the battle-tested JTAG and SWD that you can already use with all the open tools you could expect. However, there’s also plenty of available resources on the FPGA, including even a currently unutilized RISC-V softcore. If you wanted to add support for any other family of devices to this debugger, sky’s the limit! And, of course, there’s cool software to go with it – for example, orbmortem, which keeps a ring buffer of instructions in memory and shows you the last code executed before your CPU stops, or orbstat, a tool for profiling your embedded code.

If you’re looking to purchase effortless feature parity with Segger or Lauterbach devices, the ORBTrace doesn’t promise that. Instead, it’s an open debugging toolkit project, with hardware available for purchase, and software just waiting for you take control of it. This project’s community hangs out in the 1BitSquared discord’s #orbuculum channel, and gateware’s advancing at a rapid pace – welcoming you to join in on the fun.

ORBTrace is a powerful tool for when your goals become large and your problems become complex. And, being a community-driven experimental effort, we’ll undoubtedly see great things come out of it – like the Mooltipass project, originally developed by Hackaday community members, and still going strong.

Screenshot of a logic analyzer software, showing the SDA channel being split into three separate traces

I2C Tap Helps Assign Blame For SDA Conflicts

If you’ve ever debugged a misbehaving I2C circuit, you probably know how frustrating it can be. Thankfully [Jim] over at Hackaday.io, has a proto-boardable circuit that can help!

Inter-integrated circuit bus (aka I2C) uses open collector outputs on a two wire interface. Open collector means a device connected to the I2C bus can only pull the bus down to ground. Chips never drive a logic “HIGH” on the wires. When nothing is driving the lines low, a weak resistor pulls the lines up to VCC. This is a good thing, because I2C is also a multidrop bus — meaning many devices can be connected to the bus at the time. Without open collector outputs, one chip could drive a high, while another drives a low – which would create a short circuit, possibly damaging both devices.

Even with all this protection, there can be problems. The SCL and SDA lines in the I2C communication protocol are bidirectional, which means either a controller or a peripheral can pull it low. Sometimes, when tracing I2C communications you’ll need to figure out which part is holding the line low. With many devices sharing the same bus, that can become nigh-impossible. Some folks have tricks with resistors and analog sampling, but the tried and true method of de-soldering and physically lifting chip pins off the bus often comes into play.

[Jim’s] circuit splits SDA signal into controller-side and peripheral-side, helping you make it clear who is to blame for hiccups and stray noise. To do that, he’s using 6N137 optoisolators and LMV393 comparators. [Jim] shared a NapkinCAD schematic with us, meant to be replicate-able in times of dire need. With this design, you can split your I2C bus into four separate channels – controller-side SDA, peripheral-side SDA, combined SDA and SCL. 4 Channels might be a lot for a scope, but this is no problem for today’s cheap logic analyzers.

Continue reading “I2C Tap Helps Assign Blame For SDA Conflicts”

Two clothespin hacks mentioned in the article, side-by-side.

Need To Probe Circuits? Remember About Clothespins!

After browsing Thingiverse for some printable PCB probe designs, [Henry York] looked around and found a wooden clothespin on his desk. After some collaboration between his 3D printer and his CNC, Henry graced us with a nifty helper tool design that many of us might want to make in a pinch – a small, cheap and easy to make PCB probe, for circuits where soldering and headers are out of the question. Small magnets are glued to the clothespin, holding it flush to a magnetizable work surface (aka a toaster tray), and the probing itself is done by an extruder cleaning needle end. 3D printer and Edge.Cuts files are shared with us – thanks to Henry’s helpfulness, it should be easy to repeat if ever needed!

[Tyler Rosonke] (@zonksec) was programming a batch of badges and needed a reliable way to attach to a 6-pin ISP header – without actually soldering to the badges before they’re handed out to participants! A clothespin materialized nearby yet again – most likely, channeled from a different dimension by the spirit of numerous acrylic-cast pogopin-toothed clip-on tools we scroll by on Aliexpress. With a small perfboard piece and a bunch of pogopins jumping out of their respective drawers, it became no longer necessary to hold a bundle of male-ended pin header wires at a weird angle while nervously looking at the avrdude progress bar. This ended up saving a whole lot of time, something that’s always best spent on adding insidious bugs to the badge firmware (as well as, perhaps, easter eggs).

We’d love to hear about all the small hacks and improvements that you, hackers in our audience, invent. Whether it’s reusing a SOIC flashing clip for ISP programming or printing yourself an octopus-like contraption with needle probes, you should share it with us!

Local And Remote Debugging With GDB

As a debugger, GDB is a veritable Swiss Army knife. And just like exploring all of the non-obvious uses of a those knives, your initial response to the scope of GDB’s feature set is likely to be one of bewilderment, subsequent confusion, and occasional laughter. This is an understandable reaction in the case of the Swiss Army knife as one is unlikely to be in the midst of an army campaign or trapped in the wilderness. Similarly, it takes a tricky debugging session to really learn to appreciate GDB’s feature set.

If you have already used GDB to debug some code, it was likely wrapped in the comfort blanket of an IDE. This is of course one way to use GDB, but limits the available features to what the IDE exposes. Fortunately, the command line interface (CLI) of GDB has no such limitations. Learning the CLI GDB commands also has the advantage that one can perform that critical remote debug session even in the field via an SSH session over the 9600 baud satellite modem inside your Swiss Army knife, Cyber Edition.

Have I carried this analogy too far? Probably. But learning the full potential of GDB is well worth your time so today, let’s dive in to sharpen our digital toolsets.

Continue reading “Local And Remote Debugging With GDB”

Using Valgrind To Track Down Known And Unknown Bugs In Your Code

We all know what bugs in code are. We don’t like them when they are in programs we use, and they’re even worse when they are in code which we have written. Clearly, the best code is bug-free, but how do we get there?

This isn’t a new question, of course, just one that has become ever more important as the total number of lines of code (LoC) that run modern day society keeps increasing and which is affecting even hobbyists more and more often now that everything has a microcontroller inside.

Although many of us know the smug satisfaction of watching a full row of green result markers light up across the board after running the unit tests for a project, the painful reality is that you don’t know whether the code really is functionally correct until it runs in an environment that is akin to the production environment.  Yet how can one test an application in this situation?

This is where tools like those contained in the Valgrind suite come into play, allowing us to profile, analyze and otherwise nitpick every single opcode and memory read or write. Let’s take a look, shall we?

Continue reading “Using Valgrind To Track Down Known And Unknown Bugs In Your Code”

Debugging Electronics: To Know Why It Didn’t Work, First Find What It Is Actually Doing

Congratulations, you have just finished assembling your electronics project. After checking for obvious problems you apply power and… it didn’t do what you wanted. They almost never work on the first try, and thus we step into the world of electronics debugging with Daniel Samarin as our guide at Hackaday Superconference 2019. The newly published talk video embedded below.

Beginners venturing just beyond blinking LEDs and premade kits would benefit the most from information here, but there are tidbits useful for more experienced veterans as well. The emphasis is on understanding what is actually happening inside the circuit, which explains the title of the talk: Debugging Electronics: You Can’t Handle the Ground Truth! So we can compare observed behavior against designed intent. Without an accurate understanding, any attempted fix is doomed to failure.

To be come really good at this, you need to embrace the tools that are often found on a well stocked electronics bench. Daniel dives into the tricks of the trade that transcend printf and blinking LED to form a plan to approach any debugging task.

Continue reading “Debugging Electronics: To Know Why It Didn’t Work, First Find What It Is Actually Doing”