We’ve all been there. When debugging a microcontroller project, we just want to put in a print statement to figure out what’s going on with the microcontroller in real time. However, advanced embedded programmers know that printf statements are verboten: they’re just too SLOW. While not fixing this plight entirely, [Atakan Sarioglu] has come up with a clever way to create readable debug messages with minimal runtime overhead.
[Atakan Sarioglu]’s innovation, called BigBug (Github), is a dynamically-generated codebook. The codebook translates abbreviated messages sent over serial (UART here) to longer-form human-readable messages. To generate the codebook, BigBug automatically parses your comments to create a lookup between an abbreviation and the long-form message. When you are running your program on the microcontroller, BigBug will translate the short codes to long messages in real-time as you send log/debug data over serial.
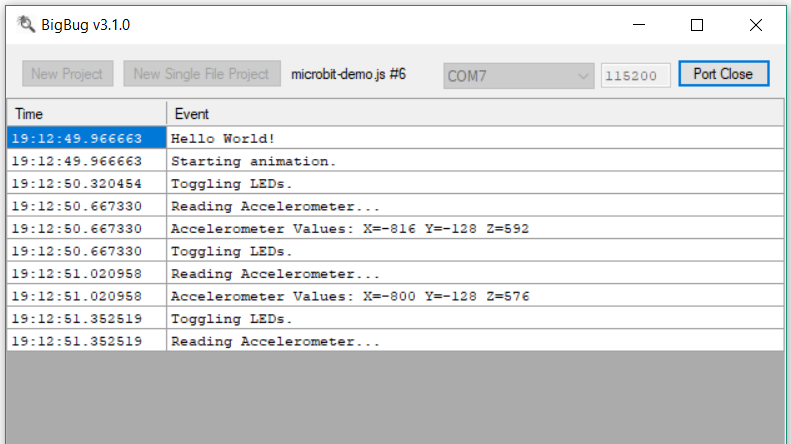
For example (not restricted to Arduino-only), if you write Serial.println("HW") //@BB[HW] Hello World!, BigBug will translate the received characters HW\n to Hello World!. In this simple example, the abbreviation uses 3 characters while the fully readable message uses 13 characters, for a savings of ~75% with no loss of clarity. More advanced usage lets you log data: Serial.println("DT 1 1") //@BB[DT] Today's Date is: {0}/{1} becomes Today's Date is 1/1. You can also use enumerated variables (last example could showToday's Date is Jan. 1 with the same print command).
In terms of real-world benefit, using a 115200 baud connection (with 8N1 encoding) this is 115200 bits per second /(8+1) bits per byte = 12800 bytes/sec = 1 byte every 80 microseconds. Sending 13 bytes of Hello World!\n (in a naive, blocking UART implementation) takes ~1 ms of CPU time. With the shortcode HW\n, it would take ~0.25 ms to send essentially the same message (then decoded by BigBug). Note that because this just operates on serial data, BigBug is language independent
If you’ve been constrained by serial throughput for debugging, this looks like a well-polished tool to solve your problems. If you are just using an Arduino and throughput is no issue, then try this tool to debug Arduino programs. Or you could always double-down and use a microcontroller to debug another microcontroller.


Good information!
HaD is now publishing in Greek?
What? Is it? What does that have to do with this article?
I always thought that flipping one or more GPIO pins state and checking with some LED’s, a multimeter or an oscilloscope was the way to go.
For very realtime code, yes, as setting a GPIO pin is generally one or two cycles, and thus influences your code very little.
Event debugging (the goal of this code) however, is generally a different beast, as you want to know what is happening, in what sequence. Does assume your UART keeps working, which is not always the case if you are debugging some difficult issues.
Also using good development system with integrated debugger and step-by-step execution (easyAVR, PicKit, …) speeds up debugging in many cases. But such toys always come with a price tag a bit higher than Arduino Uno and it’s serial.println debugging.
This is pretty clever.
My preferred choice is implementing buffered putchar with DMA, so that it’s not really terribly slow unless you keep overflowing the buffer.
Amazing, have been waiting for this a very long time now, never had the courage to make it, and went to 1M baudrate with DMA transmission.
Pitty it’s not linux/crossplatform.
Another simple option is to implement a printf( int a, int b, int c, int d) function, and then just send the binary values of a,b,c,d over the UART. That way, you can write normal printf() statements (except for dynamic %s arguments). You do the printf formatting on the host, using a firmware image file to look up the format strings.
Precisely. Unless the numeric values are almost always tiny, sending their string forms is an unnecessary waste of MCU processing and bandwidth.
Otherwise, good concept. I can say from experience, having used a tool that does this very same thing, that it’s quite effective.
Using symbols for verbose lookup is as old as the hills.
“If you’ve been constrained by serial throughput for debugging”… you’re doing it wrong. Either use some intelligence on the sending side, or use a more appropriate debug method.
First time I played with ARM, I was trying to port a RTOS to a new series. Needless to say that having hardware debugging helps a lot. Being able to trace, inspect peripherals in the background, or even do some postmortem crash analysis when you are playing with a new architecture is really helpful. The real time profiling helped me found one one of my bugs.
After that I wouldn’t bother using a new microcontroller that didn’t have (cheap) hardware debug. It is a waste of my time when there are plenty modern parts that have it. e.g. ARM, STM8,EFM8.
Printf is fine, expect for when it isn’t. Don’t overdo it. Don’t use in time-sensitive parts (eg between receiving a radio packet and responding with an ACK). Don’t use it in interrupt context. Bump UART speed to 230′ or 460′ if 115200 is too slow for you.
Printfs are great in that the provide easily readable information directly – no need to sit and translate. It’s great when you need to follow along for a long time, eg during a network formation. It can be hard to correlate the printf output from one with another device, so use timestamps on the serial consoles – that will help with most tasks apart from small timing differences.
Also use prefix in the output, so you know what part of the code causing the output. Eg, “failed” is not useful – “radio: init failed” is more useful.
I usually use GPIOs and a logic analyzer to debug when the timing is sensitive. The problem can be to know where a pin toggle corresponds to what part of the code, if you are using it to follow the event, eg during a bootup. In such situations, I either use different pins, or toggle them a set number of times (eg toggle 2 times here, 3 times there, and so on).
A clue to when printfs aren’t well suited, is when the problem isn’t reproducible anymore with printfs enabled.
> Don’t use in time-sensitive parts (eg between receiving a radio packet and responding with an ACK
I’ve done that. But instead of having printf send to a UART, I had a FIFO where I stored the call parameters, and then used a slower process to get them out, do the formatting, and send result to UART. That way I could follow real time interrupts.
> use prefix in the output, so you know what part of the code causing the output
A simple way to do that is using __FILE__ and __LINE__ macros. You can even incorporate those in another macro.
Good idea. Especially for filling that unused microcontroller’s memory.
It sounds like error codes from Microsoft Windows.
I was once involved in writing a logging system to be used for the development of a set top box (satellite tv receiver). I used magic comments similar to this to tie the logic together and provide filtering. But it didn’t occur to me to abbreviate the traffic over the serial port.
When I integrated it into the various modules of the software, it turned out that nothing was being logged because I had given the logging task the lowest priority. Only when I gave it the HIGHEST priority did it work as expected. But then of course because it was making processes wait, it made the whole system useless.
I wish I knew then what I know now…
It seems Atakan Sarioglu didn’t find the DMA yet. Sigh.
Why not a pre-processor that looks for any occurance of a macro, e.g. “debug;” and replaces it with a printf(#) where the # is the line number of the source code file? Then the program connects that to the comment after the macro or with a link to that line in the code listing. The line number could be base64 encoded so you xmit even fewer characters. Could take a parameter of a variable and so you get both the line number and the value of that variable.