Hacked Oscilloscope Plays Breakout, Hints At More

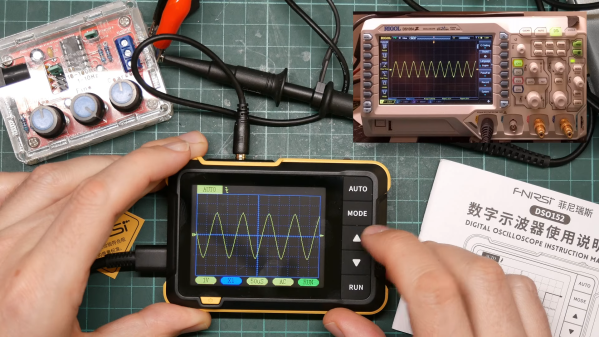
You know things are getting real when the Dremel is one of the first tools you turn to after unboxing your new oscilloscope. But when your goal is to hack the scope to play Breakout, sometimes plastic needs to be sacrificed.

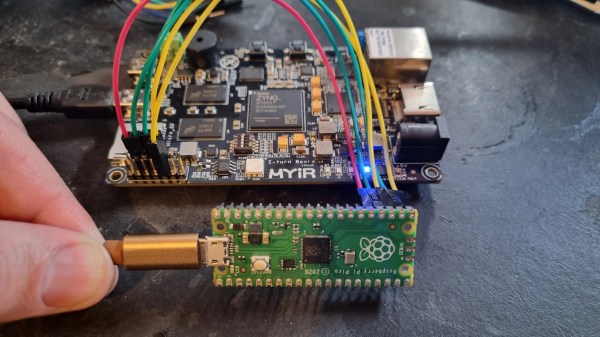
Granted, the scope in question, a Fnirsi DSO152, only cost [David Given] from Poking Technology a couple of bucks. And while the little instrument really isn’t that bad inside, it’s limited to a single channel and 200 kHz of bandwidth, so it’s not exactly lab quality. The big attractions for [David] were the CH32F103 microcontroller and the prominent debug port inside, not to mention the large color LCD panel.

[David]’s attack began with the debug port and case mods to allow access, but quickly ground to a halt when he accidentally erased the original firmware. But no matter — tracing out the pins is always an option. [David] made that easier by overlaying large photos of both sides of the board, which let him figure out which buttons went to which pins, and mapping for the display’s parallel interface. He didn’t mess with any of the analog stuff except to create a quick “Hello, oscilloscope!” program to output a square wave to the calibration pin. He did, however, create a display driver and port a game of breakout to the scope — video after the hop.

We’ve been seeing a lot of buzz around the CH32xx MCUs lately; seeing it start to show up in retail products is perhaps a leading indicator of where the cheap RISC chips are headed. We’ve seen a few interesting hacks with them, but we’ve also heard tell they can be hard to come by. Maybe getting one of these scopes to tear apart can fix that, though.

Continue reading “Hacked Oscilloscope Plays Breakout, Hints At More”

Showing the ESP-Prog-Adapter board plugged into the ESP-Prog adapter, wired to a SOIC clip, that then attaches to a PCB under test

ESP-Prog-Adapter Makes Your ESP32 Tinkering Seamless

Did you ever struggle with an ESP32 board of yours, wishing you had exposed that UART, or seriously lacking the JTAG port access? If so, you should seriously check out [0xjmux]’s ESP-PROG-Adapter project, because [0xjmux] has put a lot of love and care into making your ESP32 hardware interfacing a breeze. This project shows you how to add JTAG and UART headers with extra low board footprint impact, gives you a KiCad library to do so super quickly, and shares a simple and helpful adapter PCB you can directly use with the exceptionally cheap Espressif’s ESP-Prog dongle you should have bought months ago.

The hardware is perfect for ZIF no-soldering interfacing – first of all, both UART and JTAG can be connected through a SOICBite connection, a solderless connector idea that lets you use SPI flashing clips on specially designed pads at the edge of your board. For the fancy toolkit hackers among us, there’s also a Tag Connect symbol suggested and a connector available, but it carries JTAG that you will already get with the SOICBite, so it’s maybe not worth spending extra money on.

Everything is fully open-source, as one could hope! If you’re doing ESP32 hacking, you simply have to order this board and a SOIC clip to go with it, given just how much trouble [0xjmux]’s board will save you when programming or debugging your ESP32 devices. Now, you don’t strictly need the ESP-Prog dongle – you could remix this into an adapter for the Pi Pico board instead. Oh, and if designing boards with ARM CPUs are your thing, you might benefit from being reminded about the Debug Edge standard!

This Arduino Debugger Uses The CH552

One of the things missing from the “classic” Arduino experience is debugging. That’s a shame, too, because the chips used have that capability. However, the latest IDE has the ability to work with external debuggers and if you want to get started with a classic ATMega Arduino, [deqing] shows you how to get started with a cheap CH552 8-bit USB microcontroller board as the debugging dongle.

The CH552 board in question is a good choice, primarily because it is dirt cheap. There are design files on GitHub (and the firmware), but you could probably pull the same trick with any of the available CH552 breakout boards.

Continue reading “This Arduino Debugger Uses The CH552”

A Pi Pico connected to a MYIR Z-turn board with a set of jumper wires

Need A JTAG Adapter? Use Your Pico!

JTAG is a powerful interface for low-level debugging and introspection of all kinds of devices — CPUs, FPGAs, MCUs and a whole lot of complex purpose-built chips like RF front-ends. JTAG adapters can be quite obscure, or cost a pretty penny, which is why we’re glad to see that [Adam Taylor] from [ADIUVO] made a tutorial on using your Pi Pico board as a JTAG adapter. This relies on a project called XVC-Pico by [Dhiru Kholia], and doesn’t require anything other than a Pi Pico board itself — the XVC-Pico provides both a RP2040 firmware implementing the XVC (Xilinx Virtual Cable) specification and a daemon that connects to the Pico board and interfaces to tools like Vivado.

First part of the write-up is dedicated to compiling the Pico firmware using a Linux VM. There’s a pre-built .uf2 binary available in the GitHub repo, however, so you don’t have to do that. Then, he compiles and runs a daemon on the PC where the Pico is connected, connects to that daemon through Vivado, and shows successful single-stepping through code on a MYIR Z-turn board with a Xilinx XC7Z020. It’s worth remembering that, if your FPGA’s (or any other target’s) JTAG logic levels are 1.8V or 2.5V-based, you will need a level shifter between it and the Pi Pico, which is a board firmly in the 3.3V realm.

You just cannot beat the $3 price and the ease of setup. Pi Pico is shaping up to be more and more of a hardware multi-tool. Just a month ago, we covered how the Pico can work as a logic analyzer. A lot of that, we have the PIO peripherals to thank for — an assembly of state machines that even let you “bitbang” high-speed interfaces like DVI. If you’re interested in how PIO functions, there are some good write-ups around here. Lacking a Pi Pico, you can use this board’s bigger sister to interface with JTAG, too.

JTAG Hat Turns Raspberry Pi Into A Networked Debugger

Over the last year or so we’ve noticed a definite uptick in the number of folks using OpenOCD on the Raspberry Pi. It’s a cheap and convenient solution for poking around with various microcontrollers and embedded devices, but not always the most elegant. Looking to improve on the situation somewhat, [Matthew Mets] has been working on a purpose-built JTAG Hat to clean things up a bit.

Onboard level shifters allow you connect to JTAG and SWD interfaces from 1.8 to 5 V, and if you power the target device from the Pi itself, there’s even support for measuring the voltage and current. To connect up to your target, the open hardware board features a “legacy” pin header perfect for jumper wires, as well as a dedicated 10-pin Cortex Debug Connector. Whether you spin up your own or buy one assembled, it certainly looks like a tool worth having around if you often find yourself working with the appropriate chips.

In addition to the design files for the hardware, [Matthew] has also provided some nice documentation on how to get the software side of things up and running. Starting with a blank SD card, it walks you through the initial setup of the Raspberry Pi all the way through the installation and configuration of a patched version of OpenOCD designed to support the JTAG Hat.

If you spend more time working with 8-bit AVR chips, don’t worry. Last year we covered a similar project to turn everyone’s favorite Linux SBC into an all-in-one microcontroller development powerhouse.

This Debug Connector Brings Your Issues To The Edge

Given an unknown PCBA with an ARM processor, odds are good that it will have either the standard 10 pin 0.05″ or 20 pin 0.1″ debug connector. This uncommon commonality is a boon for an exploring hacker, but when designing a board such headers require board space in the design and more components to be installed to plug in. The literally-named Debug Edge standard is a new libre attempt to remedy this inconvenience.

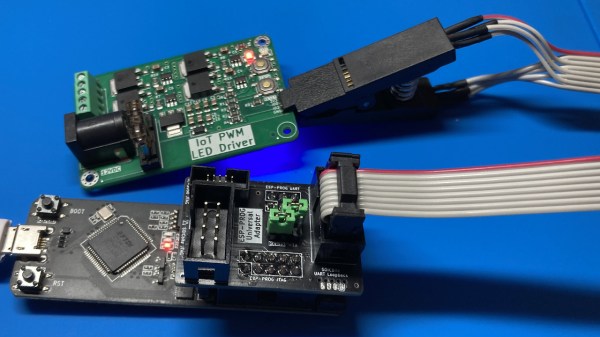
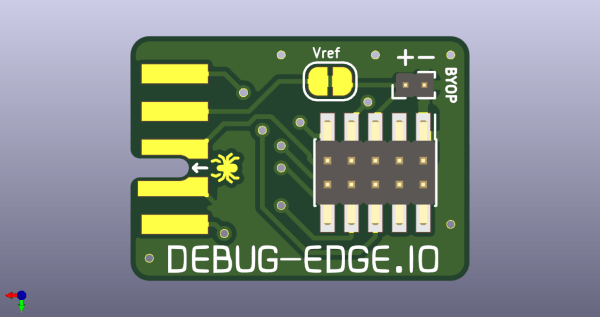
The name “Debug Edge” says it all. It’s a debug, edge connector. A connector for the edge of a PCBA to break out debug signals. Card edge connectors are nothing new but they typically either slot one PCBA perpendicularly into another (as in a PCI card) or hold them in parallel (as in a mini PCIe card or an m.2 SSD). The DebugEdge connector is more like a PCBA butt splice.

It makes use of a specific family of AVX open ended card edge connectors designed to splice together long rectangular PCBAs used for lighting end to end. These are available in single quantities starting as low as $0.85 (part number for the design shown here is 009159010061916). The vision of the DebugEdge standard is that this connector is exposed along the edge of the target device, then “spliced” into the debug connector for target power and debug.

Right now the DebugEdge exists primarily as a standard, a set of KiCAD footprints, and prototype adapter boards on OSHPark (debugger side, target side). A device making use of it would integrate the target side and the developer would use the debugger side to connect. The standard specifies 4, 6, 8, and 10 pin varieties (mapping to sizes of available connector, the ‘010’ in the number above specifies pincount) offering increasing levels of connectivity up to a complete 1:1 mapping of the standard 10 pin ARM connector. Keep in mind the connectors are double sided, so the 4 pin version is a miniscule 4mm x 4.5mm! We’re excited to see that worm its way into a tiny project or two.

We’ve seen plenty of part-free debug and programming connectors before. Have a favorite? Let us know in the comments!

Debugging Electronics: To Know Why It Didn’t Work, First Find What It Is Actually Doing

Congratulations, you have just finished assembling your electronics project. After checking for obvious problems you apply power and… it didn’t do what you wanted. They almost never work on the first try, and thus we step into the world of electronics debugging with Daniel Samarin as our guide at Hackaday Superconference 2019. The newly published talk video embedded below.

Beginners venturing just beyond blinking LEDs and premade kits would benefit the most from information here, but there are tidbits useful for more experienced veterans as well. The emphasis is on understanding what is actually happening inside the circuit, which explains the title of the talk: Debugging Electronics: You Can’t Handle the Ground Truth! So we can compare observed behavior against designed intent. Without an accurate understanding, any attempted fix is doomed to failure.

To be come really good at this, you need to embrace the tools that are often found on a well stocked electronics bench. Daniel dives into the tricks of the trade that transcend printf and blinking LED to form a plan to approach any debugging task.

Continue reading “Debugging Electronics: To Know Why It Didn’t Work, First Find What It Is Actually Doing”