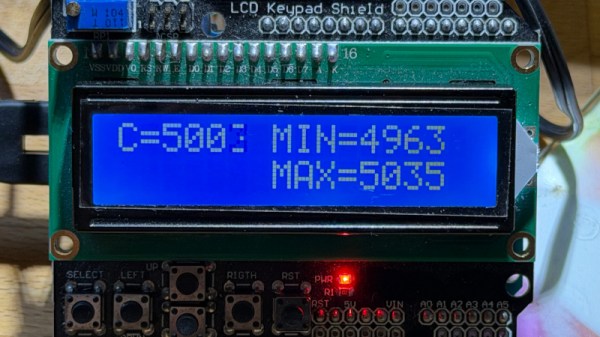
We all know the frequency of our AC grid. 60Hz for Americans, or 50Hz for Europeans, for example. But the real story has some complexity. In a plural but interconnected grid such as Europe’s, that frequency can drift around a nominal center value. To keep track of this, [Jeroen Brinkman] has created a grid monitor that can show long-term trends as well as instantaneous frequencies.
Hardware-wise, it’s somewhat old-school, with an Arduino Uno and a ubiquitous 2×16 character LCD, but the interest here lies not in the microcontroller. Sensing mains frequency is fraught with spicy high-voltage danger if done directly, so [Jeroen] is performing the task using an optocoupler that toggles an interrupt pin on the Arduino. The monitor stores long-term data by the week, using only four bytes per week. That means the monitor can hold up to 240 weeks, or about 4.6 years, on a Nano R3 and over 2,000 weeks, or around 39 years on a Nano R4. The data can be retrieved via serial transfer over the Arduino’s USB port.
The subject of grid monitoring is a fascinating one, as geopolitical events can show up in it. Back in 2018, we covered the moment when Europe lost six seconds as a result.