Every machine has its own way of communicating with its operator. Some send status emails, some illuminate, but most of them vibrate and make noise. If it hums happily, that’s usually a good sign, but if it complains loudly, maintenance is overdue. [Ariel Quezada] wants to make sense of machine vibrations and draw conclusions about their overall mechanical condition from them. With his project, a 3-axis Open Source FFT Spectrum Analyzer he is not only entering the Hackaday Prize 2016 but also the highly contested field of acoustic defect recognition.
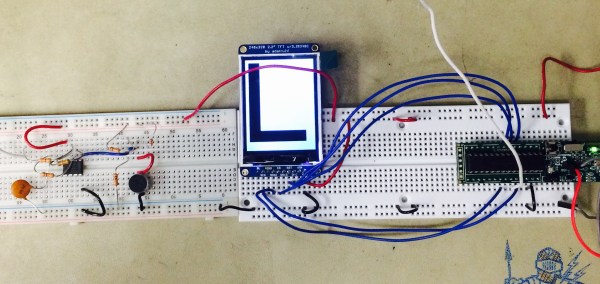
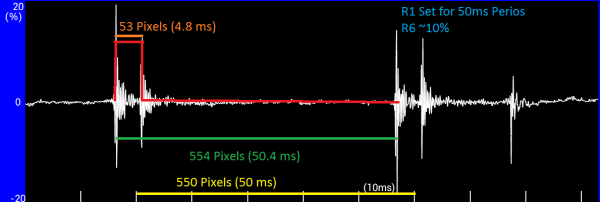
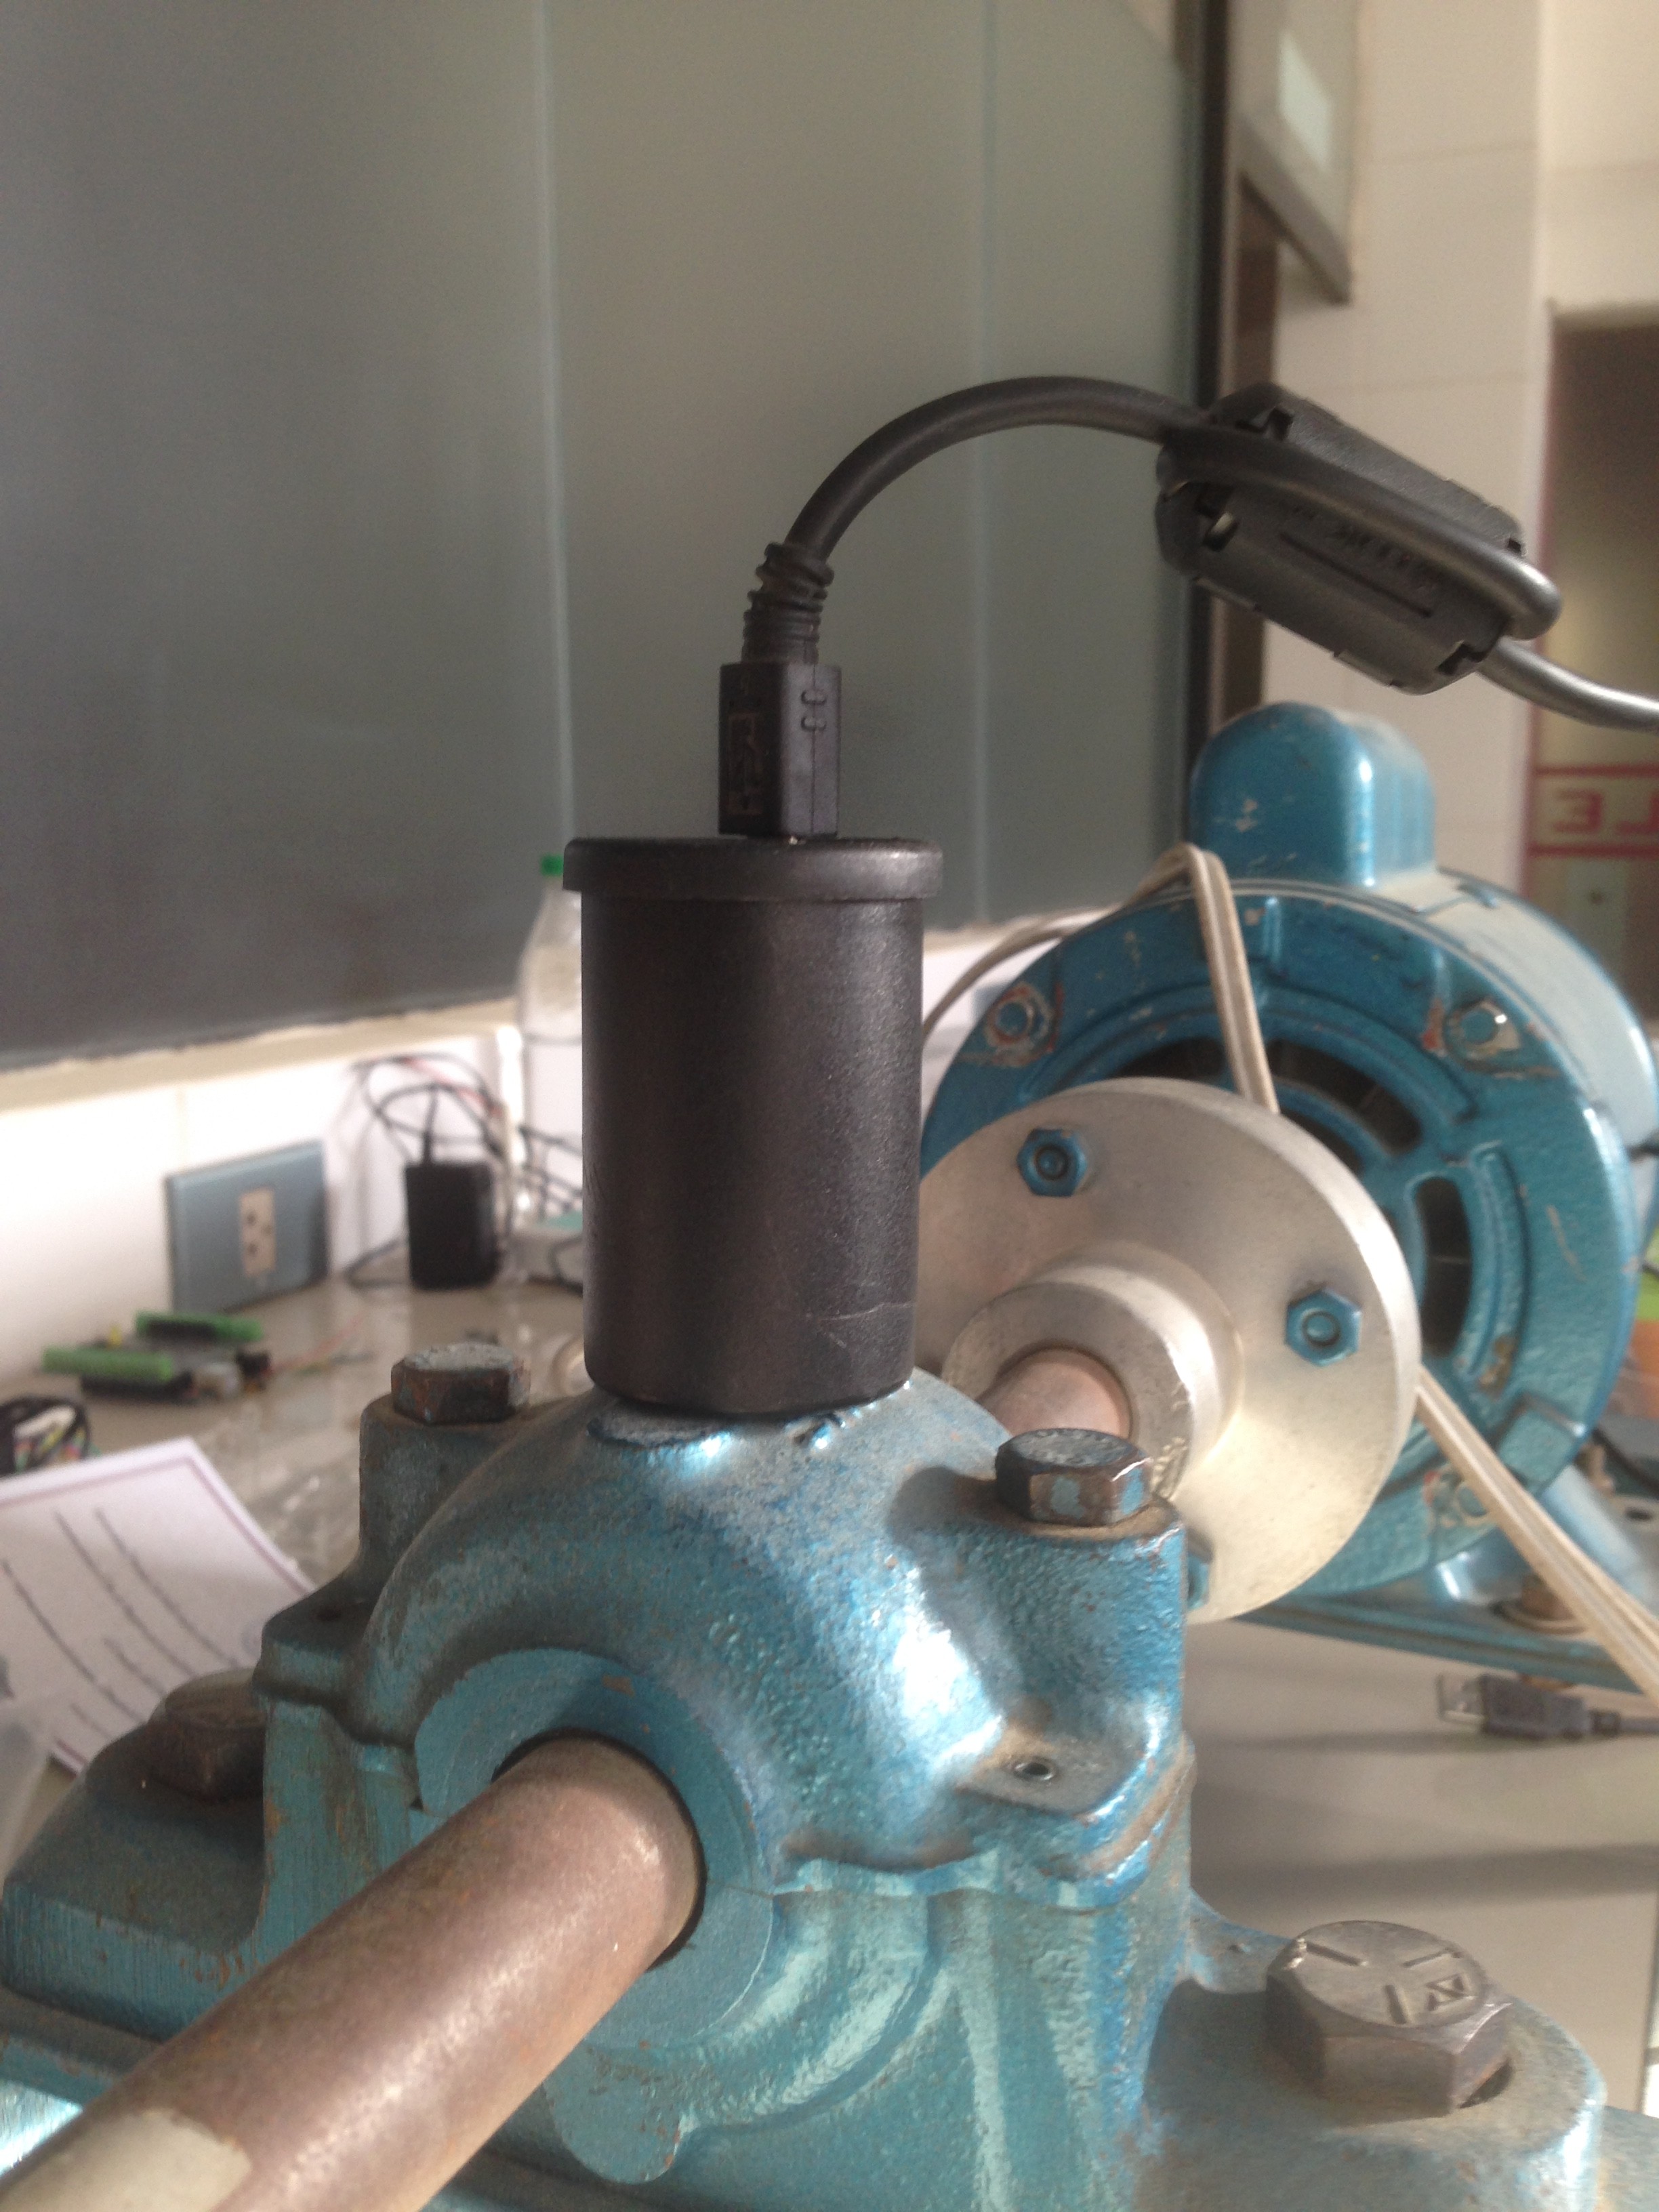 For the hardware side of the spectrum analyzer, [Ariel] equipped an Arduino Nano with an ADXL335 accelerometer, which is able to pick up vibrations within a frequency range of 0 to 1600 Hz on the X and Y axis. A film container, equipped with a strong magnet for easy installation, serves as an enclosure for the sensor. The firmware [Ariel] wrote is an efficient piece of code that samples the analog signals from the accelerometer in a free running loop at about 5000 Hz. It streams the digitized waveforms to a host computer over the serial port, where they are captured and stored by a Python script for further processing.
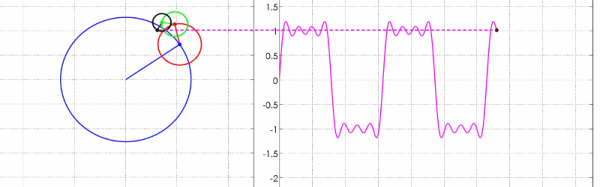
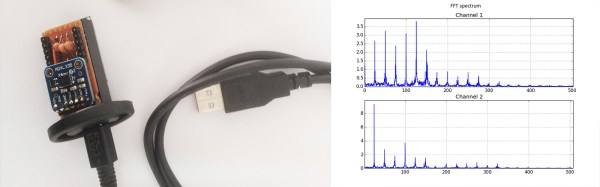
From there, another Python script filters the captured waveform, applies a window function, calculates the Fourier transform and plots the spectrum into a graph. With the analyzer up and running, [Ariel] went on testing the device on a large bearing of an arbitrary rotating machine he had access to. A series of tests that involved adding eccentric weights to the rotating shaft shows that the analyzer already makes it possible to discriminate between different grades of imbalance.