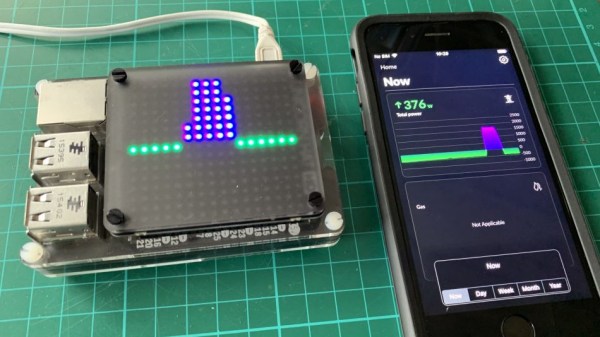
There are a lot of good reasons to have a better understanding of one’s household power use, and that is especially true for those that do their own solar power collection. For example, [Frederick] determined that it would be more efficient to use large appliances (like a dishwasher or washing machine) when there was excess solar power available, but the challenge was in accessing the right data in a convenient way. His Raspberry Pi-based live energy monitor was the solution, because it uses an LED matrix to display live energy data that can be consulted at a glance.
Interestingly, this project isn’t about hacking the power meter. What this project is really about is conveniently accessing that data when and where it is best needed. [Frederick] has a digital power and gas meter with the ability to accept a small wireless dongle. That dongle allows a mobile phone app to monitor power usage, including whether power is being taken from or exported to the grid.
Since [Frederick] didn’t want to have to constantly consult his mobile phone, a Raspberry Pi using a Pimoroni Unicorn HAT HD acts as a glanceable display. His Python script polls the power meter directly over WiFi, then creates a live display of power usage: one LED for every 250 W of power, with the top half of the display being power used, and the bottom half representing power exported to the grid. Now the decision of when to turn on which appliances for maximum efficiency is much easier, not by automating the appliances themselves, but simply by displaying data where it needs to be seen. (This kind of thing, incidentally, is exactly the idea behind the Rethink Displays challenge of the 2021 Hackaday Prize.)
As for those of us without a digital power meter that makes it easy for residents to access power data? It turns out there is no reason a power meter’s wireless service interface can’t be sniffed with RTL-SDR.


 The tough part of the problem here is getting at reliable data. Just yesterday we saw


