Australia’s Controlled Loads Are In Hot Water

Australian grids have long run a two-tiered pricing scheme for electricity. In many jurisdictions, regular electricity was charged at a certain rate. Meanwhile, you could get cheaper electricity for certain applications if your home was set up with a “controlled load.” Typically, this involved high energy equipment like pool heaters or hot water heaters.

This scheme has long allowed Australians to save money while keeping their water piping-hot at the same time. However, the electrical grid has changed significantly in the last decade. These controlled loads are starting to look increasingly out of step with what the grid and the consumer needs. What is to be done?

Continue reading “Australia’s Controlled Loads Are In Hot Water”

Read Utility Meters Via SDR To Fill Out Smart Home Stats

[Jeff Sandberg] has put a fair bit of effort into adding solar and battery storage with associated smarts to his home, but his energy usage statistics were incomplete. His solution was to read data from the utility meter using RTL-SDR to fill in the blanks. The results are good so far, and there’s no reason similar readings for gas and water can’t also be done.

[Jeff] uses the open source home automation software Home Assistant which integrates nicely with his solar and battery backup system, but due to the way his house is wired, it’s only aware of about half of the energy usage in the house. For example, [Jeff]’s heavy appliances get their power directly from the power company and are not part of the solar and battery systems. This means that Home Assistant’s energy statistics are incomplete.

Fortunately, in the USA most smart meters broadcast their data in a manner that an economical software-defined radio like RTL-SDR can access. That provided [Jeff] with the data he needed to get a much more complete picture of his energy usage.

While getting data from utility meters is conceptually straightforward, actually implementing things in a way that integrated with his system took a bit more work. If you’re finding yourself in the same boat, be sure to look at [Jeff]’s documentation to get some ideas.

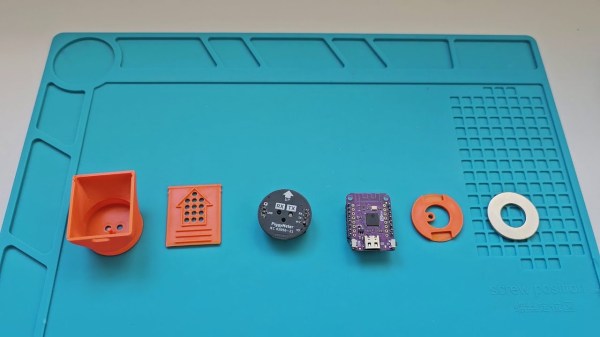
All the components of the Piggymeter interface laid out on a silicon mat

Simple Optical Meter Sets New Standards For Documentation

PiggyMeter is a wonderful example of a device that you never knew you needed – simple, elegant, easy to build, and accompanied by amazing documentation. It’s a snap-on interface for electric meters, dubbed so because its 3D printable shell looks like a pig nose, and it works with IEC62056-21 compliant meters. If you want to learn about your home’s power consumption in real time and your meter happens to fit the bill, look into building a PiggyMeter, it’s the kind of DIY project that a hacker was destined to design at some point.

All you need is a printed shell, a Wemos-compatible development board with an ESP32 MCU, an optical interface board, and a few small parts like a ring magnet. The optical interface board is not open source, but there’s drawings available, and the design is pretty simple, so it should be trivial to recreate. Plus, it’s also reasonably inexpensive if you don’t want to build your own board. Got parts? Simply put them all together, flash the firmware, and you have a meter adapter added to your smart home device family.

This device works with HomeAssistant, and it’s incredibly easy to set up, in part because of just how clearly everything is outlined in the blog post. Seriously, the documentation is written with love, and it shows. If you’re looking to learn how to document a device in a helpful way, take notes from the PiggyMeter. And, if you’d like to learn more about optically coupled power meter interfaces, here’s a different open source project we’ve covered before!

Reverse Engineering Smart Meters, Now With More Fuming Nitric Acid

If you’re lucky, reverse engineering can be a messy business. Sure, there’s something to be said for attacking and characterizing an unknown system and leaving no trace of having been there, but there’s something viscerally satisfying about destroying something to understand it. Especially when homemade fuming nitric acid is involved.

The recipient of such physical and chemical rough love in the video below is a residential electric smart meter, a topic that seems to be endlessly fascinating to [Hash]; this is far from the first time we’ve seen him take a deep dive into these devices. His efforts are usually a little less destructive, though, and his write-ups tend to concentrate more on snooping into the radio signals these meters are using to talk back to the utility company.

This time around, [Hash] has decided to share some of his methods for getting at these secrets, including decapping the ICs inside. His method for making fuming nitric acid from stump remover and battery acid is pretty interesting; although the laboratory glassware needed to condense the FNA approaches the cost of just buying the stuff outright, it’s always nice to have the knowledge and the tools to make your own. Just make sure to be careful about it — the fumes are incredibly toxic. Also detailed is a 3D-printable micropositioner, used for examining and photographing acid-decapped ICs under the microscope, which we’d bet would be handy for plenty of other microscopy jobs.

In addition to the decapping stuff, and a little gratuitous destruction with nitric acid, [Hash] takes a look at the comparative anatomy of smart meters. The tamper-proofing features are particularly interesting; who knew these meters have what amounts to the same thing as a pinball machine’s tilt switch onboard?

Continue reading “Reverse Engineering Smart Meters, Now With More Fuming Nitric Acid”

Monitoring Energy Use And Saving Money

On the surface, the electric grid might seem like a solved piece of infrastructure. But there’s actually been a large amount of computerized modernization going in the background for the past decade or so. At a large scale this means automatic control of the grid, but for some electric utility customers like [Alex] this means the rates for electricity can change every hour based on demand. By keeping an eye on the current rate, you can extract the most value from these utilities.

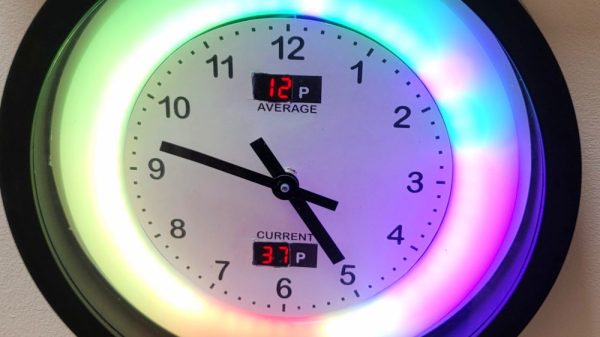
[Alex] is located in the United Kingdom and has an energy provider whose rates can change every half hour. This information is freely available well enough in advance to download the data and display it visibly in with a NeoPixel LED ring around a clock. The colors displayed by the LEDs represent an increase or decrease in price for the corresponding time and allow him to better plan out the household’s energy use for the day. The clock uses a TinyPICO ESP32 module to gather the data and handle the clock display. A second wall-mounted device shows real-time energy readings for both gas and electricity using two old analog voltmeters modified to display kilowatt-hours.

While not everyone has a utility which allows this sort of granularity with energy pricing, having one can make a bit of a difference as electricity rates under this system can sometimes go negative. [Alex] estimates that using these two displays to coordinate his energy usage has saved around £50 a month. Even if your utility offers minimal or no price adjustments for time-of-use, it’s still a good idea to monitor energy use in your home. Here’s a fairly comprehensive project that does that without modifying any existing wiring.

Smart Powermeter Uses E-Paper Display

In most places around the world, electricity is getting ever more expensive. Cutting back on your usage is one of the easier ways to escape this pain. This smart powermeter from [JGAguagdo] may prove a useful tool to achieve that goal.

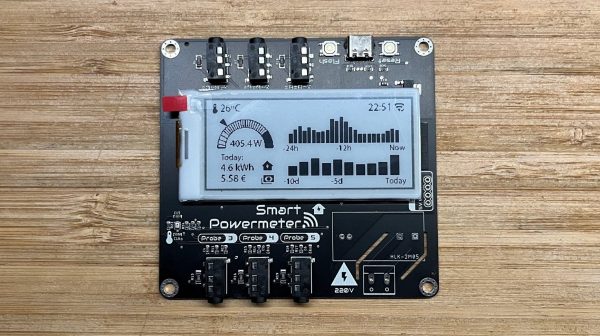
The project uses an ESP32-S2 as the brains of the operation. It’s capable of reading up to six current-transformer clamps for measuring current draw in AC devices. It also features an embedded BMP280 temperature and air pressure sensor. Live data is displayed on a 2.9-inch e-Paper display, making it clear and easy to read under normal lighting conditions. By default, it’s set up to display graphs of power usage both over the last 24 hours, and the last ten days. It can even be set up with the prevailing energy rates in your area to display a realistic figure for what you’ll pay for your daily usage.

It can even be set up to work with Home Assistant for more logging and control options. We can imagine that, with a little work, you could even do some fancy plotting of energy use versus temperature to determine the performance and cost of your home HVAC setup.

If you want one with a minimum of fuss, you can score one on Tindie. Alternatively, design files are available on GitHub, too. We’ve featured some other great power meters over the years, and if you’re cooking up your own smart designs, don’t hesitate to let us know!

Flipper Zero “Smoking” A Smart Meter Is A Bad Look For Hardware Hackers

Alright, we’re calling it — we need a pejorative equivalent to “script kiddie” to describe someone using a Flipper Zero for annoyingly malign purposes. If you need an example, check out the apparent smart meter snuff video below.

The video was posted by [Peter Fairlie], who we assume is the operator of the Flipper Zero pictured. The hapless target smart meter is repeatedly switched on and off with the Flipper — some smart meters have contactors built in so that service can be disconnected remotely for non-payment or in emergencies — which rapidly starts and stops a nearby AC compressor. Eventually, the meter releases a puff of Magic Smoke, filling its transparent enclosure and obscuring the display. The Flipper’s operator mutters a few expletives at the results, but continues turning the meter on and off even more rapidly before eventually running away from the scene of the crime.

We qualify this as “apparent” because the minute we saw this over on RTL-SDR.com, we reached out to reverse engineer par excellence and smart meter aficionado [Hash] for an opinion. Spoiler alert: [Hash] thinks it’s an elaborate hoax; the debunking starts at the 4:32 mark in the second video below. The most damning evidence is that the model of smart meter shown in the video doesn’t even have a disconnect, so whatever [Peter] is controlling with the Flipper, it ain’t the meter. Also, [Hash] figured out where [Peter] lives — he doxxed himself in a previous video — and not only does the meter shown in the video not belong to the Canadian power company serving the house, StreetView shows that there’s a second meter, suggesting that this meter may have been set up specifically for the lulz.

It should go without saying that Hackaday is about as supportive of hardware experimentation as an organization can be. But there have to be some boundaries, and even if this particular video turns out to be a hoax, it clearly steps over the line. Stuff like this paints a poor picture of what hardware hacking is all about, and leads to unintended consequences that make it harder for all of us to get the tools we need.

Continue reading “Flipper Zero “Smoking” A Smart Meter Is A Bad Look For Hardware Hackers”