Nixie Tubes Adorn Steampunk Solar Power Meter

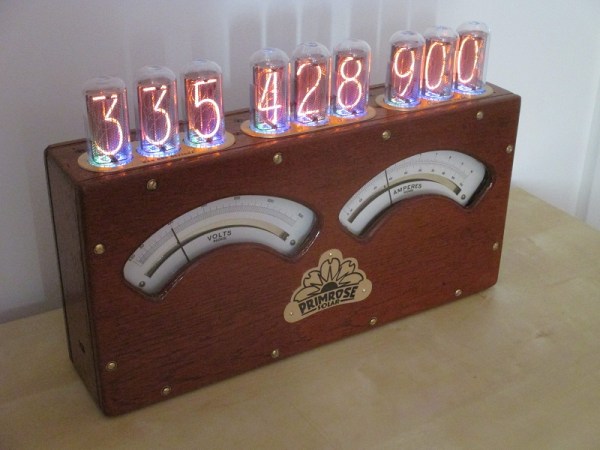
The appeal of adding Nixie tube displays to a project seems to know no end. First it was Nixie clocks, now it’s Nixie power meters, with the latest addition being this Nixie-Steampunk hybrid solar power monitor.

We’re suckers for a project with a vintage look, and this one pushes all the buttons. Built on commission for a solar power company CEO’s office, [Paul Parry]’s build is based on a Depression-era Metropolitan-Vickers combined voltmeter and ammeter. The huge meters with mirrored scales and the rich wood of the case – our guess is that it’s mahogany – made a great starting point, and after some careful hole drilling, nine IN-18 Nixies were sprouting from the case. A strip of RGB LEDs below decks added the requisite backlighting of the envelopes, and a Raspberry Pi was enlisted to interpret data from the company’s solar farm and drive the tubes and the meters. The project was capped off with a new finish on the case and a couple of fancy brass plaques.

[Paul] sent us the tip for his build after seeing the last power meter we covered, and we have to say they’re both great looking and functional projects. Keep the Nixie projects coming!

Bathroom Scale

Reverse Engineering A Bathroom Scale For Automated Weight Tracking

[Darell] recently purchased a fancy new bathroom scale. Unlike an average bathroom scale, this one came with a wireless digital display. The user stands on the scale and the base unit transmits the weight measurement to the display using infrared signals. The idea is that you can place the display in front of your face instead of having to look down at your feet. [Darell] realized that his experience with infrared communication would likely enable him to hack this bathroom scale to automatically track his weight to a spreadsheet stored online.

[Darell] started by hooking up a 38khz infrared receiver unit to a logic analyzer. Then he recorded the one-way communication from the scale to the display. His experience told him that the scale was likely using pulse distance coding to encode the data. The scale would start each bit with a 500ms pulse. Then it would follow-up with either another 500ms pulse, or a 1000ms pulse. Each combination represented either a 1 or a 0. The problem was, [Darell] didn’t know which was which. He also wasn’t sure in which order the bits were being transmitted. He modified a software plugin for his logic analyzer to display 1’s and 0’s on top of the waveform. He then made several configurable options so he could try the various representations of the data.

Next it was time to generate some known data. He put increasing amounts of weight on the scale and recorded the resulting data along with the actual reading on the display. Then he tried various combinations of display settings until he got what appeared to be hexadecimal numbers increasing in size. Then by comparing values, he was able to determine what each of the five bytes represented. He was even able to reconstruct the checksum function used to generate the checksum byte.

Finally, [Darell] used a Raspberry Pi to hook the scale up to the cloud. He wrote a Python script to monitor an infrared receiver for the appropriate data. The script also verifies the checksum to ensure the data is not corrupted. [Darell] added a small LED light to indicate when the reading has been saved to the Google Docs spreadsheet, so he can be sure his weight is being recorded properly.