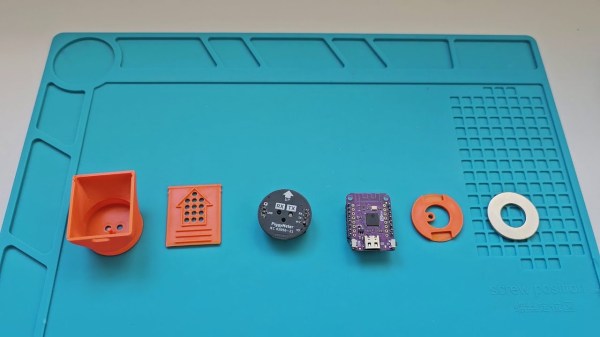
All the components of the Piggymeter interface laid out on a silicon mat

Simple Optical Meter Sets New Standards For Documentation

PiggyMeter is a wonderful example of a device that you never knew you needed – simple, elegant, easy to build, and accompanied by amazing documentation. It’s a snap-on interface for electric meters, dubbed so because its 3D printable shell looks like a pig nose, and it works with IEC62056-21 compliant meters. If you want to learn about your home’s power consumption in real time and your meter happens to fit the bill, look into building a PiggyMeter, it’s the kind of DIY project that a hacker was destined to design at some point.

All you need is a printed shell, a Wemos-compatible development board with an ESP32 MCU, an optical interface board, and a few small parts like a ring magnet. The optical interface board is not open source, but there’s drawings available, and the design is pretty simple, so it should be trivial to recreate. Plus, it’s also reasonably inexpensive if you don’t want to build your own board. Got parts? Simply put them all together, flash the firmware, and you have a meter adapter added to your smart home device family.

This device works with HomeAssistant, and it’s incredibly easy to set up, in part because of just how clearly everything is outlined in the blog post. Seriously, the documentation is written with love, and it shows. If you’re looking to learn how to document a device in a helpful way, take notes from the PiggyMeter. And, if you’d like to learn more about optically coupled power meter interfaces, here’s a different open source project we’ve covered before!

Versatile Energy Meter Has Multiple Functions

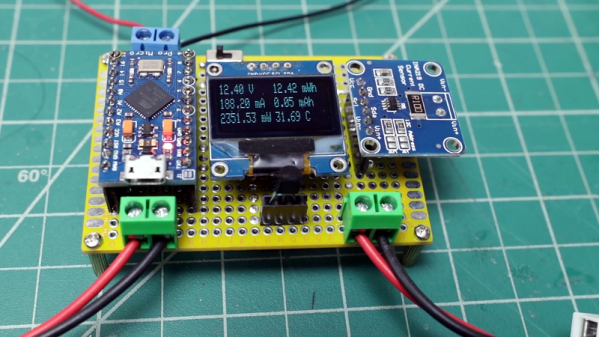
If you are dealing with solar or battery power, you might want to have one of these little energy meters built by [Open Green Energy] around. The Arduino-based instrument measures DC voltage, current, power, energy, capacity, and temperature. The range is only up to 26 volts and 3.2 amps, but you could extend that with some external circuitry.

Of course, measuring a voltage with the Arduino is old hat. But the addition of a INA219 current sensor provides voltage, current, and power measurements in a single module that talks I2C back to the host computer.

Continue reading “Versatile Energy Meter Has Multiple Functions”

Measuring Energy Consumption

You would think that measuring a lot of sophisticated AC power parameters such as active and reactive power, RMS voltage and current, and line frequency would be a big job. As it turns out in so many cases, there’s a chip for that. The Microchip MCP39F511 can do all of that, but needs a little help from a few transformers. [Boris Landoni] has a two-part post that not only shows such a meter built with the chip but also has a very detailed description of the operation of the IC and how it works. The set-up takes two transformers. One to step the voltage down and another to measure the current.

Maybe it was just us, but we found the two schematics to be a little confusing. The schematic with two ICs on it is the actual board with the MCP39F511 (the other IC is a voltage regulator). The schematic with the transformer on it appears to have a single IC, U1, but that’s not really the case at all. U1 on that schematic is the entire circuit board from the first schematic. The “IC” pin numbers on the second schematic are the CN2 pins on the first schematic. The CN1 and CN2 on the two schematics are not related at all other than U1 is the actual board from the first schematic.

Continue reading “Measuring Energy Consumption”

Meter All The Phases: Three Phase Energy Meter With OpenWrt

Keeping track your overall electricity usage is a good thing, and it’s even better if you know where all the kilowatt-hours are going. [Anurag Chugh’s] house has the three phases coming from the electrical distribution box tidily organized: One for the lighting and fans, one for household appliances, and one for the hot water supply. To monitor and analyze the electrical fingerprint of his house, [Anurag] installed a 3 phase energy meter and hooked it up to the internet.

Continue reading “Meter All The Phases: Three Phase Energy Meter With OpenWrt”

Energy Monitor Optically Couples To Smart Meter

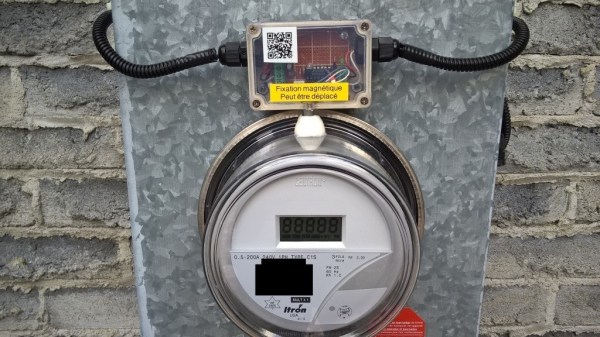
Hackers love to monitor things. Whether it’s the outside temperature or the energy used to take a shower, building a sensor and displaying a real-time graph of the data is hacker heaven. But the most interesting graphs comes from monitoring overall power use, and that’s where this optically coupled smart-meter monitor comes in.

[Michel]’s meter reader is pretty straightforward. His smart wattmeter is equipped with an IR LED that pips for every watt-hour consumed, so optical coupling was a natural approach. The pulse itself is only 10 ms wide, so he built a pulse stretcher to condition the pulse for a PIC microcontroller. The PIC also reads the outside temperature with a DS18B20 and feeds everything to the central power monitor, with an LCD display and a classic Simpson meter to display current power usage. The central monitor sends the power and temperature data to Thingspeak, along with data from [Michel]’s wood-stove monitor and a yet-to-be-implemented water heater monitor.

[Michel] is building out an impressive suite of energy and environmental monitors for his Quebec base of operations. We’re looking forward to seeing how he monitors that water heater, and to see what other ideas he comes up with.

Continue reading “Energy Monitor Optically Couples To Smart Meter”

Finally, A Power Meter Without Nixies

We’ve had quite a spate of home-brew energy meters on the tip line these days, and that probably reflects a deep inner desire that hackers seem to have to quantify their worlds. Functionally, these meters have all differed, but we’ve noticed a distinct stylistic trend toward the “Nixies and wood” look. Ironically, it is refreshing to see an energy meter with nothing but a spartan web interface for a change.

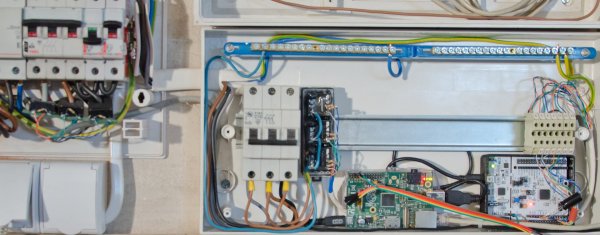
Clearly, [Tomasz Salwach] had raw data in mind as a design goal, and his Raspberry Pi-based meter delivers. After harvesting current sensing transformers from a bucket of defunct power meter PC boards, [Tomasz] calibrated them with a DIY oscilloscope and wired them and the voltage sensors up to an STM32 Nucleo development board. Data from the MCU goes to the Pi for processing and display as snazzy charts and GUI elements served internally. [Tomasz] was kind enough to include a link to his meter in his tip line post, but asked that we not share it publicly lest HaD readers love the Pi to death. But we can assure you that it works, and it’s kind of fun to peek in on the power usage of a house in Poland in real time.

It’s a nice project that does exactly what it set out to do. But if you missed the recent spate of Nixie-based displays, check out this front hallway meter or this one for a solar-power company CEO’s desk.

Nixie Tubes Adorn Steampunk Solar Power Meter

The appeal of adding Nixie tube displays to a project seems to know no end. First it was Nixie clocks, now it’s Nixie power meters, with the latest addition being this Nixie-Steampunk hybrid solar power monitor.

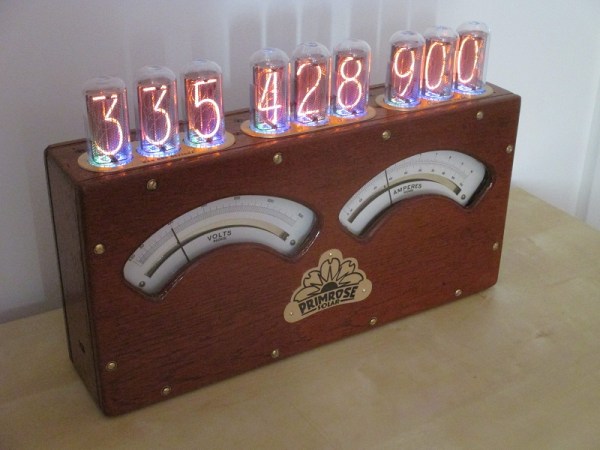
We’re suckers for a project with a vintage look, and this one pushes all the buttons. Built on commission for a solar power company CEO’s office, [Paul Parry]’s build is based on a Depression-era Metropolitan-Vickers combined voltmeter and ammeter. The huge meters with mirrored scales and the rich wood of the case – our guess is that it’s mahogany – made a great starting point, and after some careful hole drilling, nine IN-18 Nixies were sprouting from the case. A strip of RGB LEDs below decks added the requisite backlighting of the envelopes, and a Raspberry Pi was enlisted to interpret data from the company’s solar farm and drive the tubes and the meters. The project was capped off with a new finish on the case and a couple of fancy brass plaques.

[Paul] sent us the tip for his build after seeing the last power meter we covered, and we have to say they’re both great looking and functional projects. Keep the Nixie projects coming!