Equalize Your Listening With HiFiScan

Audiophiles will go to such extents to optimize the quality of their audio chain that they sometimes defy parody. But even though the law of diminishing returns eventually becomes a factor there is something in maintaining a good set of equipment. But what if your audio gear is a little flawed, can you fix it electronically? Enter HiFiScan, a piece of Python software to analyse audio performance by emitting a range of frequencies and measuring the result with a microphone.

This is hardly a new technique, and it’s one which PA engineers have used for a long time to tune out feedback resonances, but an easy tool bringing it to the domestic arena is well worth a look. HiFiScan is a measuring tool so it won’t magically correct any imperfections in your system, however it can export data in a format suitable for digital effects packages.

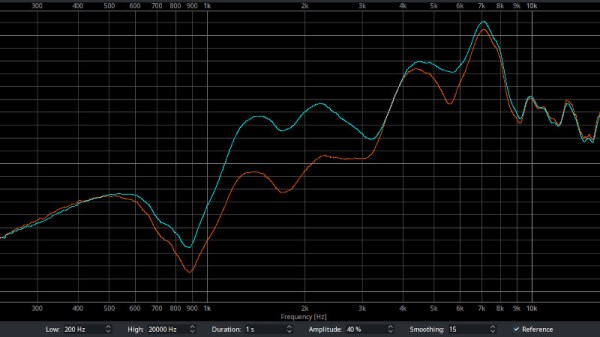
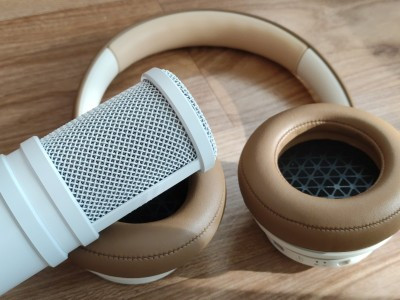
Naturally its utility is dependent on the quality of the hardware it’s used with, but the decent quality USB microphone used in the examples seems to give good enough results. We see it used in a variety of situations, of which perhaps the most surprising is a set of headphones that have completely different characteristics via Bluetooth as when wired.

If audio engineering interests you, remember we have an ongoing series: Know Audio.

Putting 3D Printed Speaker Drivers To The Test

Over the years, we’ve seen numerous projects that attempted to 3D print speaker enclosures that deliver not only a bit of custom flair, but hopefully halfway decent sound. Though as you’d probably expect, the drivers themselves are always standard run-of-the mill hardware mounted into the plastic enclosure. But given the research being conducted by [Paul Ellis], that might not be a safe assumption for much longer.

His quest to develop a full-range 3D speaker has taken him through several design revisions over the last two years, with each one being put through testing procedure that compared its frequency response to “real” speakers from manufacturers like Dayton and Bose. The project is very much ongoing, but a recently completed iteration of the driver design managed to exceed 80 dB at 1 W. In terms of audio quality, [Paul] reports they can hold their own against commercially available drivers. You can hear for yourself in the video after the break.

Ultimately, he hopes to be able to sell his 3D printed speakers in kit form to anyone who’s looking for the last word in bespoke audio hardware. The idea being that the drivers and enclosure will be completely modular, allowing the user to swap out individual components for ones printed (or not) in different materials so they can tune the in-person sound to their exact specifications. To facilitate this rapid reconfiguring of the drivers, the designs use some neat tricks like having the magnets be removable rather than glued in so they could be swapped out non-destructively.

This isn’t the first fully 3D printed speaker driver we’ve ever seen, Formlabs showed one off that was made on their SLA printer back in 2015, and we actually saw a rudimentary take on the same idea earlier this year. But the work that [Paul] has done here is certainly the most thorough, and dare we say practical, take we’ve ever seen on the concept.

Continue reading “Putting 3D Printed Speaker Drivers To The Test”

Measuring Frequency Response With An RTL-SDR Dongle And A Diode

[Hans] wanted to see the frequency response of a bandpass filter but didn’t have a lot of test equipment. Using an RTL-SDR dongle, some software and a quickly made noise generator, he still managed to get a rough idea of the filter’s characteristics.

How did he do it? He ‘simply’ measured his noise generator frequency characteristics with and without the bandpass filter connected to its output and then subtracted one curve with the other. As you can see in the diagram above, the noise generator is based around a zener diode operating at the reverse breakdown voltage. DC blocking is then done with a simple capacitor.

Given that a standard RTL-SDR dongle can only sample a 2-3MHz wide spectrum gap at a time, [Hans] used rtlsdr-scanner to sweep his region of interest. In his write-up, he also did a great job at describing the limitations of such an approach: for example, the dynamic range of the ADC is only 48dB.

Bode Plots On An Oscilloscope

bode

Bode plots – or frequency response graphs – are found in just about every piece of literature for high-end audio equipment. It’s a simple idea, graphing frequency over amplitude, but making one of these graphs at home usually means using a soundcard, an Excel spreadsheet and a multimeter, or some other inelegant solution. Following a neat tutorial from [Dave Jones], [Andrew] came up with a very simple way to make a Bode plot in real-time with an oscilloscope, a microcontroller, and a few off-the-shelf parts.

The basic idea behind [Dave Jones]’ impromptu Bode plotter is to configure a frequency generator to output a sine wave that ramps up over a period of time. Feed this sine wave through a filter, and you have amplitude on the vertical axis of your ‘scope and frequency on the horizontal axis. Boom, there’s your Bode plot.

[Andrew] did [Dave] one better by creating a small circuit with an Arduino and an AD9850 sine wave generator. Properly programmed, the AD9850 can ramp up the frequency of a sine wave with the Arduino outputting sync pulses every decade or octave of frequency, depending if you want a linear or log Bode plot.

It’s a nifty little tool, and when it comes to building test equipment from stuff that just happens to by lying around, we’ve got to give it up for [Andrew] for his really cool implementation.