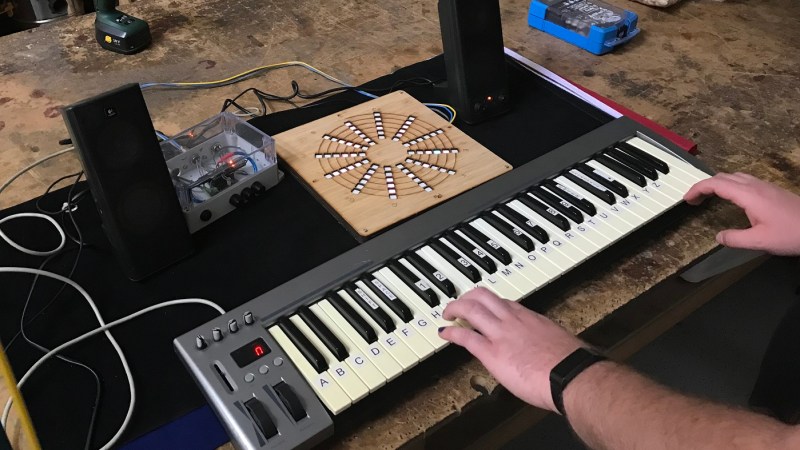
Displaying notes live as they are being played can be a really powerful learning tool, but it’s usually used to learn how to play a specific instrument. This take on the topic is actually a neat way to learn more about music theory — how pitches work together to build the sounds that we hear. The visual tack chosen arranges each of 12 notes into a spiral. As you continue to go up the scale through more octaves, pitches that share the same name line up into a line like a ray projecting out from the sun. So there are 12 rays for the notes in the scale: C, C#/D♭, D, D#/E♭,F, etc.
[mechatronicsguy] built it a few years back but just now got around to documenting it, and we’re sure glad he did. The layout of notes at first looks just like a colorful visualization. But as he mentions in his description, this assigns a shape to each different type of cord. A major cord will have the same shape whether it is played with C, G#, B♭, or any other note as the root. The shape simply rotates around the axis based on that root note. Higher octaves will be shown further out on the radius, but the chord shape will still be the same. Minor, augmented, even modal chords and those with added pitches all have their own unique shape on the display.
You get the best understanding of the visualization by looking at the Python-rendered version in the video below. It’s a nice touch that notes turn grey and fade away after being released so you kind of see where the current chord came from. This isn’t strictly a perk of pre-recordings. While you can feed it MIDI files, you can also play a MIDI instrument and display the visuals live on the hardware version that uses a Teensy with an audio shield.
If you’re looking for examples on how music visualizers are used to teach the instrument, look no further than this Wurlitzer note visualizer replica. Also for those who don’t know, the song being played in the hardware demo (second video below) is Beethoven’s 7th Symphony. Well worth a full listen, it’ll change your life.


Very nice! Anyone maybe knows a project that would do the same, but real-time FFT / FHT per notes? Think “Color Organ” (Spectrum Analyzer), but narrow-banded, per note frequency, and then putting all “octaved” notes to one light channel? Please, post here, if you know such! Thank You!
Photosounder Spiral is what you are looking for.
I fully understand that it displays 12 notes but if it had the white keys only there would be 8 not 7 segments. The most common mistake that happens when counting in music, and counting in general. This display makes a case for iso-keyboards. All same chords are the same pattern. In the beginning there were 7 notes in different modes. The white keys were first and F# and B flat came after then the rest.
The decription of the note layout was particularly confusing in the Hackaday article and very simply and nicely explained in the actual writeup. Also it’s a musical cHord, not a cord. Also also, Beethoven’s seventh is a piece of music, not a song. Also also also, that’s not Beethoven’s 7th.
Thank you; the actual writeup did indeed quickly make it clear to someone who thinks in frequencies not notes and to whom A, B, etc just means a hexadecimal number (obviously a typo with that G).
I should have also said I love the project (with apologies for appearing negative).