If you’ve been even casually following NASA’s return to the Moon, you’re likely aware of the recent Wet Dress Rehearsal (WDR) for the Artemis II mission. You probably also heard that things didn’t go quite to plan: although the test was ultimately completed and the towering Space Launch System (SLS) rocket was fully loaded with propellant, a persistent liquid hydrogen leak and a few other incidental issues lead the space agency to delay further testing for at least a month while engineers make adjustments to the vehicle.
This constitutes a minor disappointment for fans of spaceflight, but when you’re strapping four astronauts onto more than five million pounds of propellants, there’s no such thing as being too cautious. In fact, there’s a school of thought that says if a WDR doesn’t shake loose some gremlins, you probably weren’t trying hard enough. Simulations and estimates only get you so far, the real thing is always more complex, and there’s bound to be something you didn’t account for ahead of time.
Although at its face the results seem obvious, a recent study by [Sandrah Eckel] et al. on the impact of electric cars in California is interesting from a quantitative perspective. What percentage of ICE-only cars do you need to replace with either full electric or hybrid cars before you start seeing an improvement in air quality?
A key part of the study was the use of the TROPOMI instrument, part of the European Sentinel-5 Precursor satellite. This can measure trace gases and aerosols in the atmosphere, both of which directly correlate with air quality. The researchers used historical TROPOMI data from 2019 to 2023 in the study, combining this data with vehicle registrations in California and accounting for confounding factors, such as a certain pandemic grinding things to a halt in 2020 and massively improving air quality.
Although establishing direct causality is hard using only this observational data, the researchers did show that the addition of 200 electric vehicles would seem to be correlated to an approximate 1.1% drop in measured atmospheric NO2. This nitrogen oxide is poisonous and fatal if inhaled in large quantities. It’s also one of the pollutants that result from combustion, when at high temperatures nitrogen from the air combines with oxygen molecules. Continue reading “Correlating Electric Cars With Better Air Quality”→
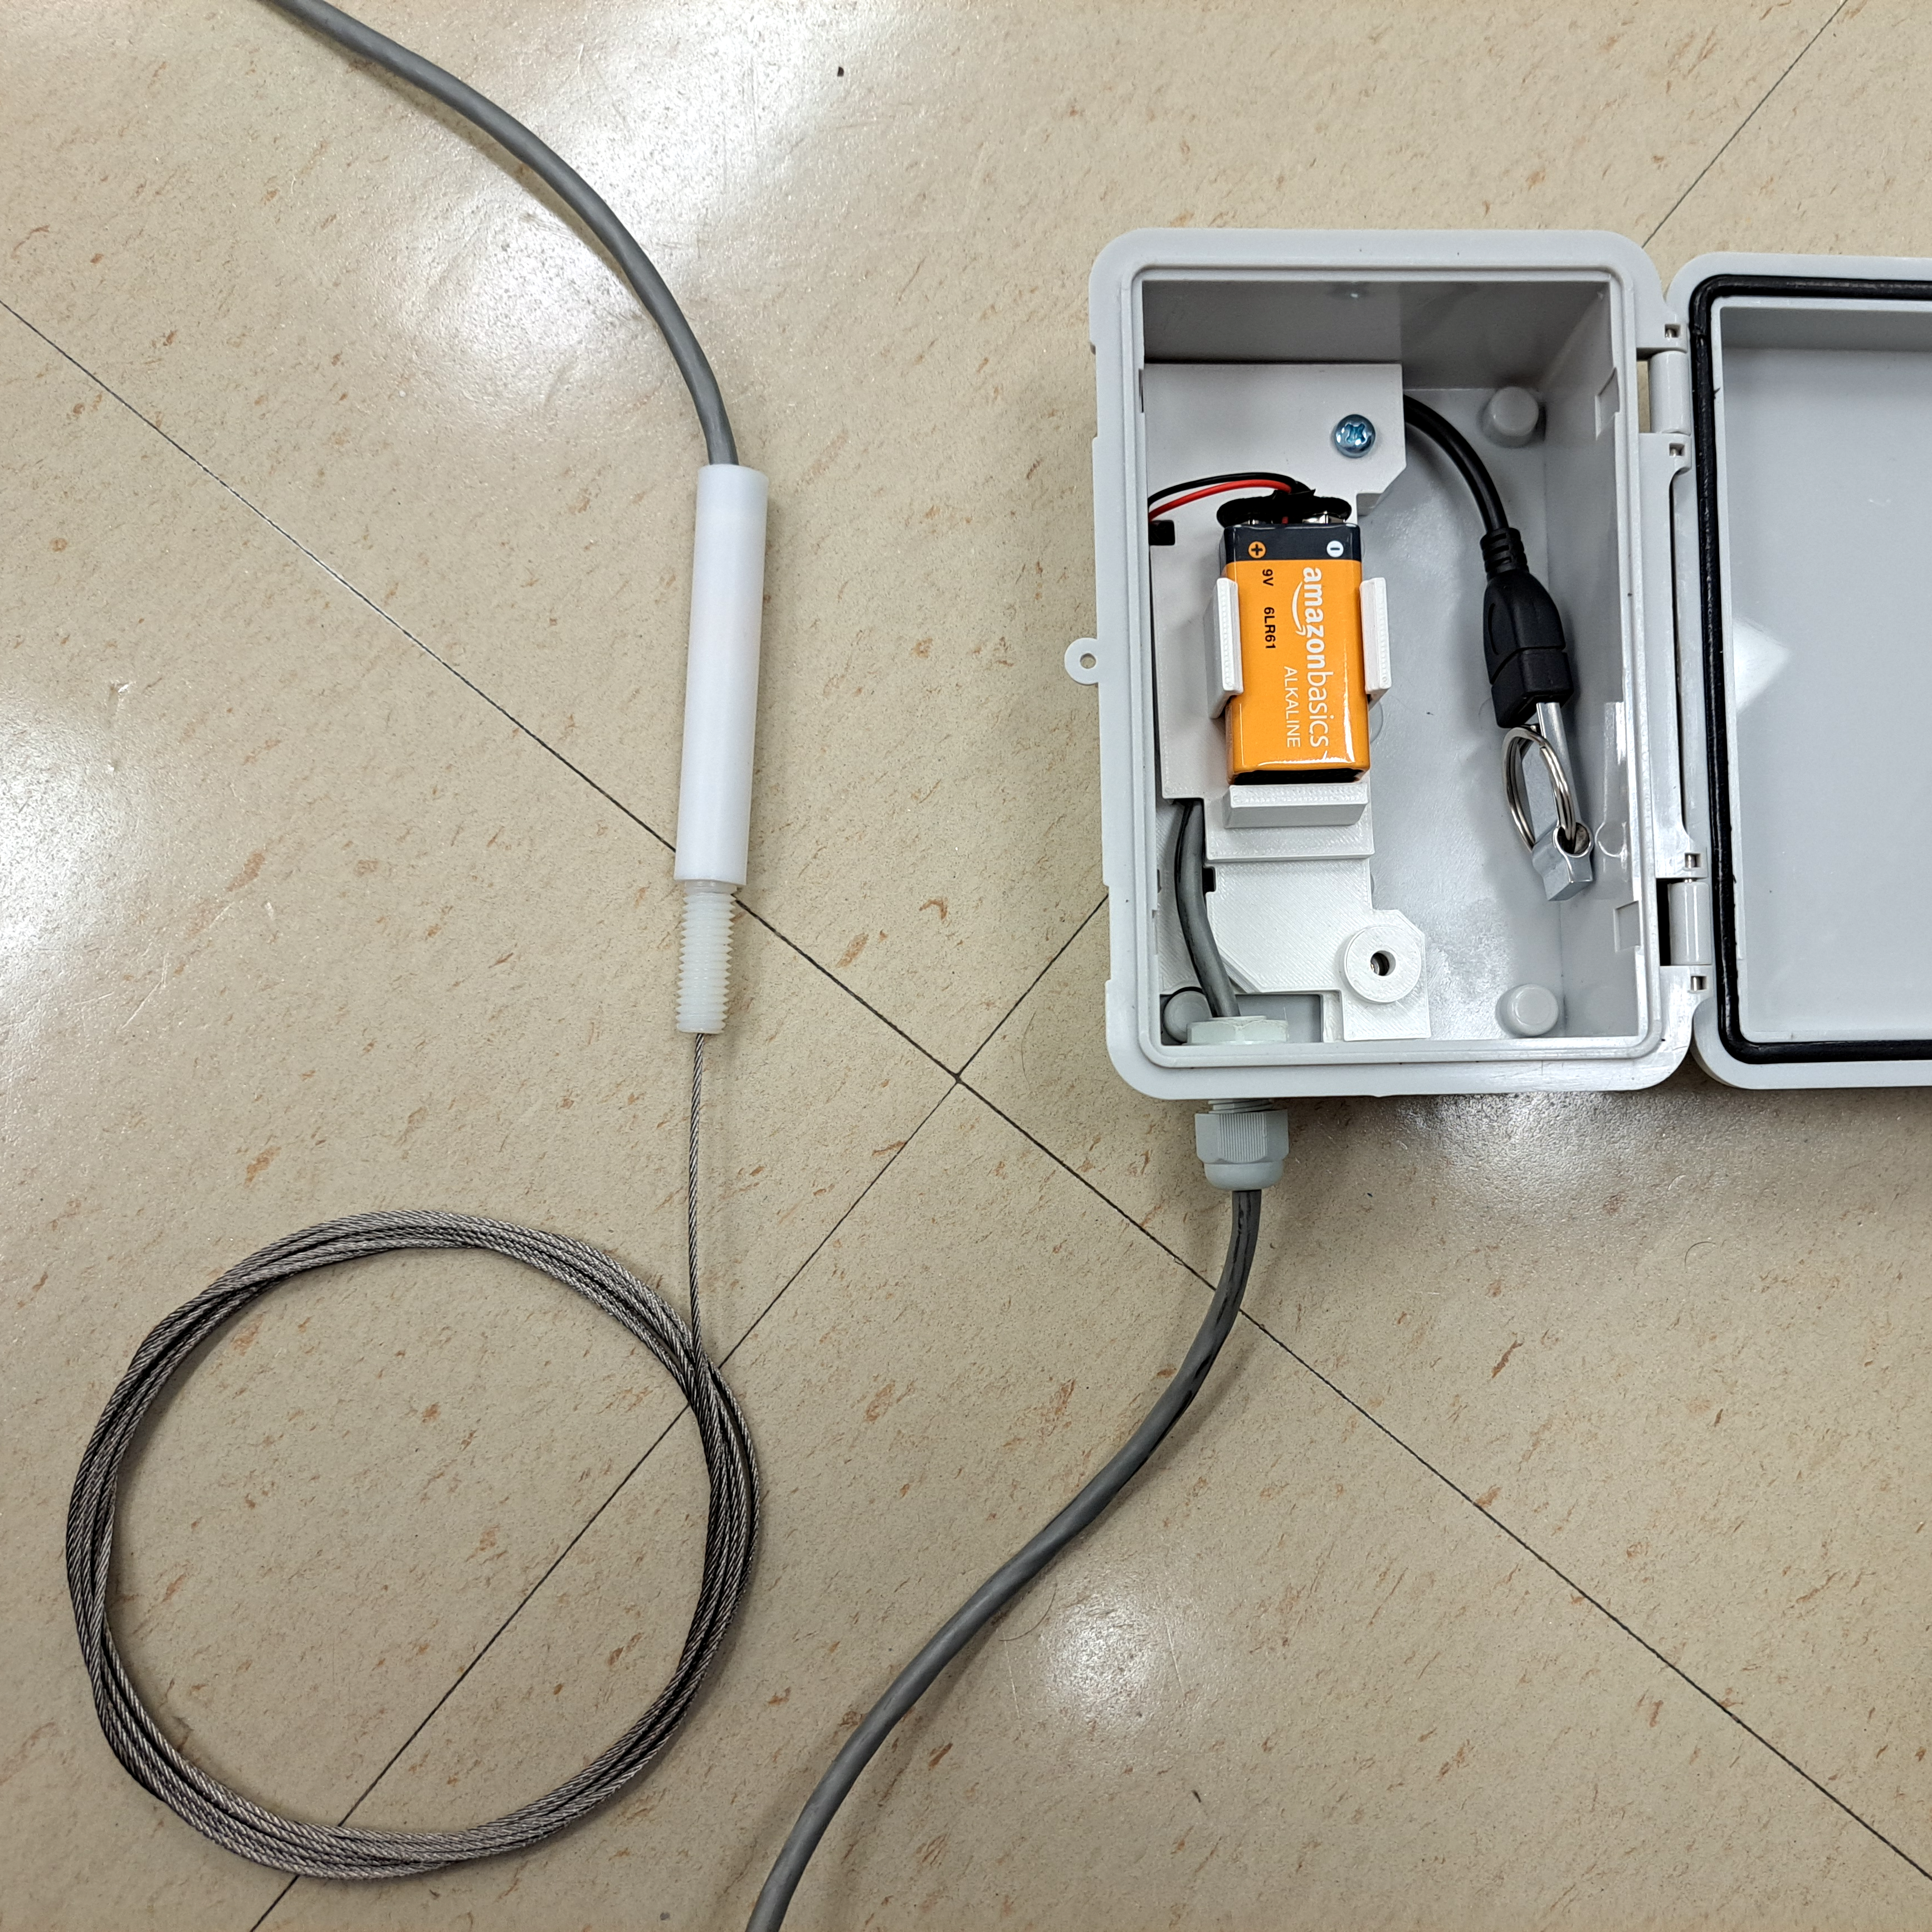
Water wells are simple things, but that doesn’t mean they are maintenance-free. It can be important to monitor water levels in a well, and that gets complicated when the well is remote. Commercial solutions exist, of course, but tend to be expensive and even impractical in some cases. That’s where [Hans Gaensbauer]’s low-cost, buoyancy-based well monitor comes in. An Engineers Without Border project, it not only cleverly measures water level in a simple way — logging to a text file on a USB stick in the process — but it’s so low-power that a single battery can run it for years.
The steel cable (bottom left) is attached to a submerged length of pipe, and inside the cylinder is a custom load cell. The lower the water level, the higher the apparent weight of the submerged pipe.
The monitor [Hans] designed works in the following way: suspend a length of pipe inside the well, and attach that pipe to a load cell. The apparent weight of the pipe will be directly proportional to how much of the pipe is above water. The fuller the well, the less the pipe will seem to weigh. It’s very clever, requires nothing to be in the well that isn’t already water-safe, and was designed so that the electronics sit outside in a weatherproof enclosure. Cost comes out to about $25 each, which compares pretty favorably to the $1000+ range of industrial sensors.
The concept is clever, but it took more that that to create a workable solution. For one thing, space was an issue. The entire well cap was only six inches in diameter, most of which was already occupied. [Hans] figured he had only about an inch to work with, but he made it work by designing a custom load cell out of a piece of aluminum with four strain gauges bonded to it. The resulting sensor is narrow, and sits within a nylon and PTFE tube that mounts vertically to the top of the well cap. Out from the bottom comes a steel cable that attaches to the submerged tube, and out the top comes a cable that brings the signals to the rest of the electronics in a separate enclosure. More details on the well monitor are in the project’s GitHub repository.
All one has to do after it’s installed is swap out the USB stick to retrieve readings, and every once in a long while change the battery. It sure beats taking manual sensor readings constantly, like meteorologists did back in WWII.