Colorchord steampunk dead bug device

Electronic ColorChord Turns Color Into Sound

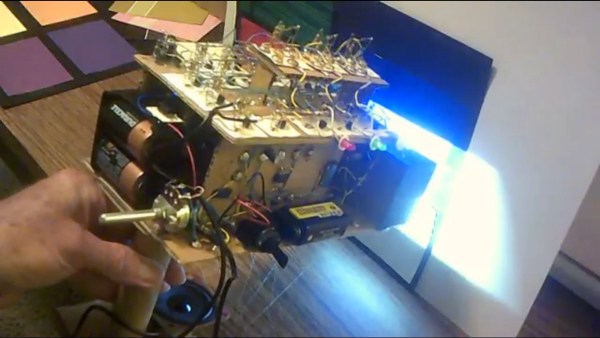
[Dr. Cockroach] has delighted us again with another of his circuits on cardboard. He calls it steampunk inspired, and while we guess we can see what he’s getting at, it’s more like a sweet example of artful dead bug construction. He calls it the ColorChord. Point its photo cells at a color and it’ll play a tone or a combination of tones specific to that color.

Three 555-centric boards use thumbtacks as connection points which he solders to, the same technique he used for his cardboard computer. They provide simple tones for red, green, and blue and a mix for any other color. However, he found that the tones weren’t distinguishable enough for similar colors like a bright sun yellow and a reddish yellow. So he ended up pulsing them using master oscillator, master-slave flip-flop, and sequencer circuits, all done dead bug style.

We’re not sure how practical it is but the various pulsed tones remind us of the B space movies of the 1950s and 60s. And as for the look of it, well it’s just plain fun to look at. Hear and see it for yourself in the video below.

And if you want to see some dead bug circuitry as high art then check out this awesome LED ring, this sculptural nixie clock, and perhaps the most wondrous of all, The Clock.

Continue reading “Electronic ColorChord Turns Color Into Sound”

DIY Optoisolator

MacGyvered Optoisolator Is A Great Introduction

Sometimes the best way to learn about a technology is to just build something yourself. That’s what [Dan] did with his DIY optoisolator. The purpose of an optoisolator is to allow two electrical systems to communicate with each other without being electrically connected. Many times this is done to prevent noise from one circuit from bleeding over into another.

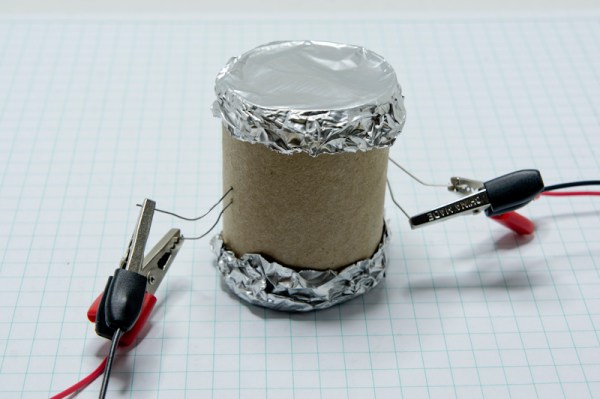
[Dan] built his incredibly simple optoisolator using just a toilet paper tube, some aluminum foil, an LED, and a photo cell. The electrical components are mounted inside of the tube and the ends of the tube are sealed with foil. That’s all there is to it. To test the circuit, he configured an Arduino to send PWM signals to the LED inside the tube at various pulse widths. He then measured the resistance on the other side and graphed the resulting data. The result is a curve that shows the LED affects the sensor pretty drastically at first, but then gets less and less effective as the frequency of the signal increases.

[Dan] then had some more fun with his project by testing it on a simple temperature controller circuit. An Arduino reads a temperature sensor and if the temperature rises above a certain value, it turns on a fan to cool the sensor off again. [Dan] first graphed the sensor data with no fan hooked up. He only used ambient air to cool things down. The resulting graph is a pretty smooth curve. Next he hooked the fan up and tried again. This time the graph went all kinds of crazy. Every time the fan turned on, it created a bunch of electrical noise that prevented the Arduino from getting an accurate analog reading of the temperature sensor.

The third test was to remove the motor circuit and move it to its own bread board. The only thing connecting the Arduino circuit to the fan was a wire for the PWM signal and also a common ground. This smoothed out the graph but it was still a bit… lumpy. The final test was to isolate the fan circuit from the temperature sensor and see if it helped the situation. [Dan] hooked up his optoisolator and tried again. This time the graph was nice and smooth, just like the original graph.

While this technology is certainly not new or exciting, it’s always great to see someone learning by doing. What’s more is [Dan] has made all of his schematics and code readily available so others can try the same experiment and learn it for themselves.