While the full steampunk aesthetic might be a bit much for most people, those antique gauges do have a certain charm about them. Unfortunately, implementing them on a modern project can be somewhat tricky. Even if you’ve got a stock of old gauges laying around, you’ve still got to modify the scale markings and figure out how to drive them with digital electronics. While we’ve seen plenty of people do it over the years, there’s no debating it’s a lot harder than just wiring up an I2C display.
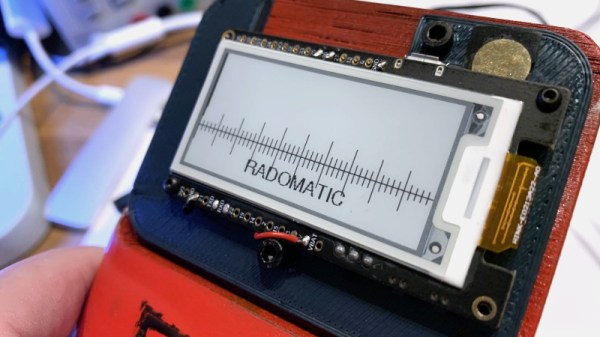
But maybe it doesn’t have to be. With his Rad-O-Matic, [Hans Jørgen Grimstad] created a pretty convincing “analog” gauge using a small e-ink panel. Of course it won’t fool anyone who gives it a close look, but at a glance, you could certainly be forgiven for thinking it was some kind of vintage indicator. Especially with the cracked and stained Fresnel lens he put in front of it.
 For this project [Hans] used a LilyGo T5, which combines an ESP32 with a 2.13 inch electronic paper display. These are presumably meant to be development boards for digital signage applications, but they occasionally show up in hacker projects since they’re so easy to work with. The board pulls data from a RD200M radon sensor over a simple UART connection, and the current reading is indicated by a “needle” that moves across a horizontal scale on the display.
On its own, it wouldn’t look very vintage. In fact, quite the opposite. But [Hans] really helped sell the look on this project by designing and 3D printing a chunky enclosure and then weathering it to make it look like it’s been kicking around since the Cold War.
If you don’t feel like faking it, we’ve seen some very impressive projects based on authentic vintage gauges. As long as you don’t mind tearing up hardware that’s likely older than you are, putting in the extra effort necessary for a convincing modification can really pay off.
[Thanks to Tarjei for the tip.]


