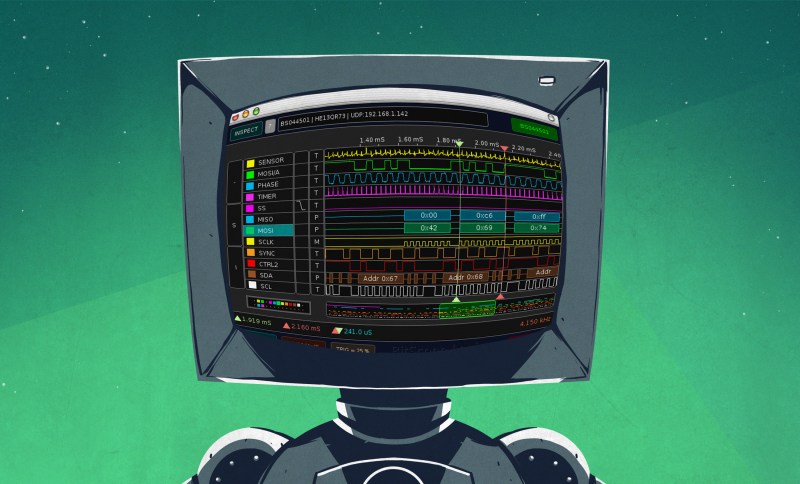
Last time, we looked into using a logic analyzer to decode SPI signals of LCD displays, which can help us reuse LCD screens from proprietary systems, or port LCD driver code from one platform to another! If you are to do that, however, you might find a bottleneck – typically, you need to capture a whole bunch of data and then go through it, comparing bytes one by one, which is quite slow. If you have tinkered with Pulseview, you probably have already found an option to export decoded data – all you need to do is right-click on the decoder output and you’ll be presented with a bunch of options to export it. Here’s what you will find:
2521888-2521888 I²C: Address/data: Start

2521896-2521947 I²C: Address/data: Address write: 22

2521947-2521954 I²C: Address/data: Write

2521955-2521962 I²C: Address/data: ACK

2521962-2522020 I²C: Address/data: Data write: 01

2522021-2522028 I²C: Address/data: ACK

2522030-2522030 I²C: Address/data: Start repeat

2522038-2522089 I²C: Address/data: Address read: 22

2522089-2522096 I²C: Address/data: Read

2522096-2522103 I²C: Address/data: ACK

2522104-2522162 I²C: Address/data: Data read: 91

2522162-2522169 I²C: Address/data: NACK

2522172-2522172 I²C: Address/data: Stop
Whether on the screen or in an exported file, the decoder output is not terribly readable – depending on the kind of interface you’re sniffing, be it I2C, UART or SPI, you will get five to ten lines of decoder output for every byte transferred. If you’re getting large amounts of data from your logic analyzer and you want to actually understand what’s happening, this quickly will become a problem – not to mention that scrolling through the Pulseview window is not a comfortable experience.
The above output could look like this: 0x22: read 0x01 ( DEV_ID) = 0x91 (0b10010001). Yet, it doesn’t, and I want to show you how to correct this injustice. Today, we supercharge Pulseview with a few external scripts, and I’ll show you how to transfer large amounts of Sigrok decoder output data into beautiful human-readable transaction printouts. While we’re at it, let’s also check out commandline sigrok, avoiding the Pulseview UI altogether – with sigrok-cli, you can easily create a lightweight program that runs in the background and saves all captured data into a text file, or shows it on a screen in realtime!
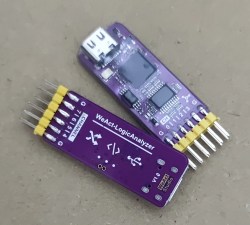 Oh, and while we’re here, I’d like to show you a pretty cool thing I’ve found on Aliexpress! These are tiny FX2 boards with the same logic analyzer schematic, so they work with the FX2 open-source firmware and Sigrok – but they’re much smaller, have USB-C connectors instead of cable struggle that is miniUSB, and are often even cheaper than the ‘plastic case’ FX2 analyzers we’ve gotten used to. In addition to that, since you can see the exposed PCB, unlike with the ‘plastic case’ analyzers, you know whether you’re getting input buffers or not!
Boiling It Down
As an example, let’s consider a capture of the I2C bus of the Pinecil soldering iron. On this bus, there’s three I2C devices – a 96×16 OLED screen at the address 0x3c, an accelerometer at 0x18, and the FUSB302B USB-PD PHY at 0x22. The FUSB302B is a chip that we remember from the USB-C low-level PD communication articles where we built our own PD trigger board. I could only have written those articles because I got the logic analyzer captures, processed them into transaction printouts, and used those to debug my PD code – now, you get to learn how to use such captures for your benefit, too.
 If you open the above files in Pulseview – you will see a whole bunch of I2C traces. I wanted to zone in on the FUSB302, naturally – accelerometer and OLED communications are also interesting but weren’t my focus. You will also see that there’s a protocol decoder called “I2C filter” attached. Somehow, it’s been remarkably useless for me whenever I try to use it, not filtering out anything at all. No matter, though – right click on the I2C decoder output row (the one that shows decoded bytes and events), click “Export all annotations for this row”, pick a filename, then open the file in a text editor.
The view you get is a bit overwhelming – we get 22,000 lines of text, which is nowhere near the kind of data you could feasibly read through. Of course, most of that is LCD transfer data, and there’s a fair bit of accelerometer querying, too – you want to filter out both of these if you want to only see the FUSB302 transactions. Nevertheless, it’s a good start – you get a text file that contains all the activity happening on the I2C bus, it’s just too much text to read through on your own.
Here’s an example line: 2521783-2521834 I²C: Address/data: Address write: 30. This is very easy to process, if you take a closer look at it! Each line describes an I2C event, and it starts with two timestamps – event start and event end, separated by - . Then, we get three more values, separated by spaces – decoder name, decoder event type, and the decoder event itself. This output format can be changed in Pulseview settings, if you’re so inclined, however, you can easily parse it as-is. For this format, we can simply split the string by space (not splitting further than three spaces), getting a timestamp, decoder name, decoder output type and decoder event.
I’ll be using Python for parsing, but feel free to translate the code into anything that works for you. Here’s a bit of Python that reads our file line-by-line and puts the useful parts of every line into variables:
with open('decoded.txt', 'r') as f:
    line = f.readline()
    while line:
        line = line.strip()
        if not line: # empty line terminates the loop, use `continue` to ignore empty lines instead
            break
        # ignoring decoder name and decoder output type - they don't change in this case
        tss, _, _, d = line.split(' ', 3)
        [ "do something with this data" ]
        line = f.readline() # get a new line and rerun the loop body
Parsing lines of text into event data is simple enough – from there, we need to group events into I2C transactions. As you can see, a transaction starts with a Start event, which we can use as a marker to separate different transactions within all the events we get. We can do the usual programming tactic – go through the events, have one “current transaction” list that we add new events to, and an “all transactions so far” list where we put transactions we’ve finished processing.
The plan is simple – in the same loop, we look at the event we get, and if it’s not a Start event, whether it’s a write/read/ACK/NACK bit event, or Stop/Start repeat event, we simply put it into the “current transaction” list. If we get a new Start event, we consider this “current transaction” list finished and add it to our list of received transactions, then start a new “current transaction” list. While we’re at it, we can also parse address and data bytes – we receive them as strings and we need to parse them as hex digits, unless you change the I2C decoder to output something else.
Here’s a link to the relevant code section. I could talk more about what it does, for instance, it filters out the FUSB302 transfers by the address, but I’d like to cut to the chase and show the input lines compared to the output transaction list. You can get this output if you run python -i parse.py and enter tr[0] in the REPL:
>>> tr[0]
['start', 34, 'wr', 'ack', 'wr', 1, 'ack', 'start repeat', 34, 'rd', 'ack', 'rd', 145, 'nack', 'stop']
Now, this is a proper I2C transaction! All of these elements are things we can visually discern in the Pulseview UI. Mind you, this code is tailored towards the FUSB302 transaction parsing, but it should not be hard to modify it so that it singles out and parses accelerometer or OLED transactions instead. From here, it’s almost enough to simply concatenate the transaction list elements and get a semi-human-readable transaction, but let’s not stop our ambitions here – the FUSB302 has documentation available, and we can get to a perfectly readable decoding of what the code actually does!
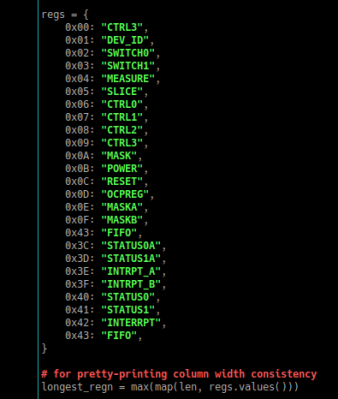 I’ve scrolled through the datasheet, and put together a Python dictionary with a register address-name mapping. Using that, we can easily go through transactions, mapping them to specific register reads and writes, and convert the raw transaction data into lines of text that clearly tell us – first, we write this byte to SWITCHES0 register, then we write a this byte into POWER register, and so on. Here’s the code I wrote to make verbose transactions – and it helps you turn logic analyzer captures into Python code!
Say, you’re writing a replacement open-source firmware for something you own, or perhaps you’re poking around copying the implementation of some protocol for your own purposes, like I copied the Pinecil’s PD implementation to help me debug my own PD code. Here’s the cool part – you can translate this kind of output into your own high-level code near-instantly, to the point where you can even modify this decoding script to output Python or C code! This is just like decompiling, except you get a language of your choice, and a human-readable description of the code’s external behaviour, which is often what you actually want.
Here’s how a verbose transaction list looks: [34, '0x22', 1, '0x01 ( DEV_ID)', 'rd', [145], '0x91 (0b10010001)']. And, this is how I can format such a transactions, using a helper function included in the code I’ve linked:
>>> tr_as_upy(transactions[0])
i2c.readfrom_mem(0x22, 0x1) # rd: DEV_ID 0x91 (0b10010001)
>>> tr_as_upy(transactions[1])
i2c.writeinto_mem(0x22, 0xc, b'\x01') # wr RESET: 0x01 (0b00000001)
Such code allows you to rapidly reverse-engineer proprietary and open-source devices, while getting a good grasp on what is it specifically that they do. What more, with such a decoder, you can also write a protocol decoder for Sigrok so that you can easily access it from Pulseview! For instance, if you’re capturing reads/writes for an I2C EEPROM, there’s an I2C EEPROM decoder in Sigrok that you can add – and, there’s never enough Sigrok decoders, so adding your own decoder to the pile is a wonderful contribution to the open-source logic analysis software that everybody knows and loves.
Going Further With Commandline
This decoding approach gives you the most control over your output data, which massively helps if you have to process large amounts of it. You can also debug intricate problems like never before. For instance, I’ve had to help someone debug a web-based ESP8266 flasher that can’t flash particular kinds of firmware images properly, and for that, I’m capturing the UART data being transferred between the PC and the ESP8266.
There’s a problem with such capturing, too – during flashing, the UART baudrate changes, with the bootloader baudrate being 76800, the flashing baudrate being 468000, and the software baudrate being 115200. As a result, you can’t pull off the usual trick where you connect a USB-UART adapter’s RX pin to your data bus and have it stream data to a serial terminal window on your monitor. Well, with granular control over how you process data captured by the logic analyzer, you don’t have to bother with that!
The idea is – you connect a logic analyzer to the data bus, and stack two UART decoders onto the same pin! Each decoder is going to throw error messages whenever the current signal is on a different baudrate than the decoder’s expected one. Now, Sigrok being a reasonably modular and open-source project, you can absolutely write a UART decoder for Sigrok that works with multiple baudrates. If you’re like me and don’t want to do that, you can also go the lazy way about it and mash the output of two decoders together in realtime, using error messages as guidance on where the switch occured!
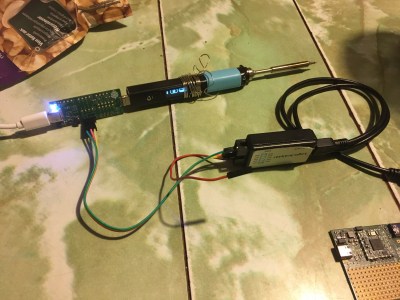
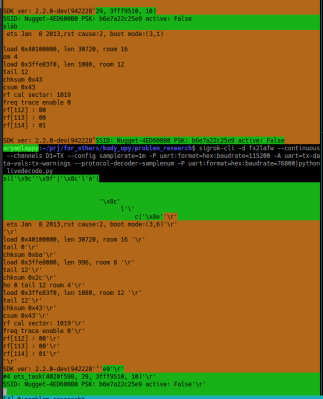
For this kind of purpose, having realtime and text-only processing of Sigrok-produced data is more than enough. Thankfully, the FX2 analyzers let you capture data indefinitely, and Sigrok commandline lets you stack protocol decoders that will then run in realtime! So, I’ve made a script that you can pipe sigrok-cli output into, which compares decoder output to figure out which baudrate is currently being used, and outputs data from the decoder with the least faults. The code’s missing a smarter buffering algo, so the switching-between-baudrates moment is a bit troublesome, as you can see in the screenshot, but it’s working otherwise!
With this Sigrok commandline approach, you gain one more logic analyzer superpower! Since FX2 analyzers let you capture data indefinitely, streaming it to your PC as it is captured, a commandline decoder lets you wire up a FX2 analyzer to a Pi Zero – so you can build a tiny device capturing and decoding a data bus 24/7. Set the FX2 and Pi Zero combo near whatever you’re trying to tap into, run sigrok, have it save data with timestamps onto an SD card, and you can collect weeks of bus activity data easily! This is the kind of capability I wish I had when I was tasked with reverse-engineering a special piece of industrial machinery, controlled over CAN and using a semi-proprietary communication algorithm; having lots of data seriously helps in such scenarios and I was struggling to capture enough.
If you’d rather keep to low-depth GUI experiments, this kind of parsing is useful too – Sigrok protocol decoders are written in Python, which means you can also take your Python output-parsing code and turn it into Pulseview-accessible protocol decoder reasonably easily. All in all, this kind of experimentation lets you squeeze as much as possible out of even the cheapest logic analyzers out there. In the next article, I’d like to go more in-depth through other kinds of logic analyzers we have available – especially all the the cheap options. Given that Sigrok has recently merged the PR with support for the Pi Pico, there’s a fair bit you can get beyond what the FX2-based analyzers have to offer!


Thank you! IMO sigrock/Pulseview deserves much more attention here on Hackaday.
I’ll second that. SigRok has been a lifesaver for my signal analysis needs over the past decade. Much love for that project.
Has the maintainer situation of Sigrok improved?
Was there ever any announcement from Uwe about leaving the project?
Best I can remember, Uwe had been asking for more help with maintenance for several years before Sigrok / Pulseview turned up in the sad state it is now.
>tiny FX2 boards
hmm some of those have cbm9c02a instead of classic Cypress 013A, whats up with that? Chinese clone or excess stock from a someone requesting custom markings?
Any why LVC431 and not classic lcv244?
Standard “whatever is available and cheap and still mostly works”?
Take a look at CBM9002A manufacturer’s website. They have a PDF with a list of their chips along with names of the original chips they can replace. No idea whether they make exact or functional clones but at least they don’t pretend being Analog Devices, Cypress or Texas Instruments.
oh, that wasnt a C, its a Corebai CBM9002A. Thank you!
“tiny FX2 board” even has a github page with diagram https://github.com/WeActStudio/LogicAnalyzerV1