A photograph with labels showing the parts of a DIY scanning spectrometer.

DIY Scanning Spectrometer Is A Bright Idea

Spectroscopy seems simple: split a beam of light into its constituent wavelengths with a prism or diffraction grating, and measure the intensity of each wavelength. The devil is in the details, though, and what looks simple is often much harder to pull of in practice. You’ll find lots of details in [Gary Boyd]’s write-up of his optical scanning spectrometer project, but no devils.

Schematic diagram of [Gary Boyd]'s spectrometer, showing optical elements and rays of light as well as major physical elements like the motor and linear stage.
Schematic diagram of [Gary Boyd]’s Czerny-Turner type scanning spectrometer.
A scanning spectrometer is opposed to the more usual camera-type spectrometer we see on these pages in that it uses a single-pixel sensor that sweeps across the spectrum, rather than spreading the spectrum across an imaging sensor.

Specifically, [Gary] has implemented a Czerny-Turner type spectrometer, which is a two-mirror design. The first concave mirror culminates the light coming into the spectrometer from its entrance slit, focusing it on a reflective diffraction grating. The second concave mirror focuses the various rays of light split by the diffraction grating onto the detector.

In this case [Gary] uses a cheap VEML 7700 ambient light sensor mounted to a small linear stage from amazon to achieve a very respectable 1 nm resolution in the range from 360 nm to 980 nm. That’s better than the human eye, so nothing to sneeze at — but [Gary] includes some ideas in his blog post to extend that even further. The whole device is controlled via an Arduino Uno that streams data to [Gary]’s PC.

[Gary] documents everything very well, from his optical mounts to the Arduino code used to drive the stepper motor and take measurements from the VEML 7700 sensor. The LED and laser “turrets” used in calibration are great designs as well. He also shares the spectra this device is capable of capturing– everything from the blackbody of a tungsten lamp used in calibration, to a cuvette of tea, to the sun itself as you can see here. If you have a couple minutes, [Gary]’s full writeup is absolutely worth a read.

This isn’t the first spectrometer we’ve highlighted– you might say we’ve shown a whole spectrum of them.

Putting More Tech Into More Hands: The Robin Hoods Of Hackaday Prize

Many different projects started with the same thought: “That’s really expensive… I wonder if I could build my own for less.” Success is rewarded with satisfaction on top of the money saved, but true hacker heroes share their work so that others can build their own as well. We are happy to recognize such generosity with the Hackaday Prize [Robinhood] achievement.

Achievements are a new addition to our Hackaday Prize, running in parallel with our existing judging and rewards process. Achievements are a way for us to shower recognition and fame upon creators who demonstrate what we appreciate from our community.

Fortunately there is no requirement to steal from the rich to unlock our [Robinhood] achievement, it’s enough to give away fruits of price-reduction labor. And unlocking an achievement does not affect a project’s standings in the challenges, so some of these creators will still collect coveted awards. The list of projects that have unlocked the [Robinhood] achievement will continue to grow as the Hackaday Prize progresses, check back regularly to see the latest additions!

In the meantime, let’s look at a few notable examples that have already made the list:

Continue reading “Putting More Tech Into More Hands: The Robin Hoods Of Hackaday Prize”

Building A Spectrophotometer

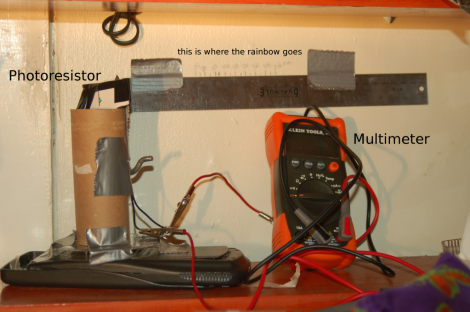
What can you make with a toilet paper roll, duct tape, and a graphing calculator? A stand for your homemade spectrometer. This is neither as pretty nor as accurate as a precision scientific instrument, but that doesn’t mean it’s useless. In fact, it works perfectly well for rudimentary observations. Light is shined through a sample solution, passes through a diffraction grating, then shows up as bands of color on the projection surface seen above. The photosensor mounted on the cardboard tube was pulled from a night-light, and is read using the ruler and the multimeter. This results in two data units that are used to graph the results. As long as you’re running test samples as a control this simple setup will yield useful information for the scientist on a shoe-string budget.

[via BoingBoing]