In the Bad Old Days, a spectrum analyser was a big piece of expensive machinery that you’d have on your bench next to your oscilloscope. And while good ones still cost a ton of money, [rheslip] shows you how to turn your VISA-compatible scope into a decent spectrum analyser for the low, low price of nothing. Watch it in action in the video below the break.
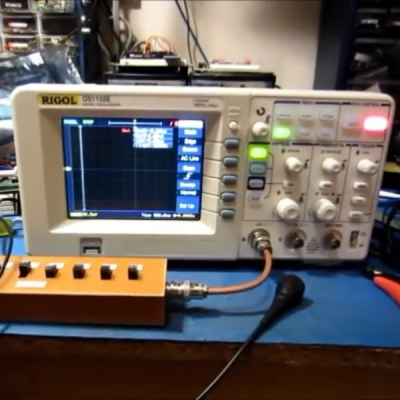 If your scope is relatively recent, like this side of the late 1990s, it might support National Instrument’s VISA: virtual instrument software architecture. [rheslip]’s Rigol scope does, and he uses PyVisa, a Python wrapper for the NI-VISA libraries to download the raw samples from the ‘scope and then crunches the FFTs out on his laptop.
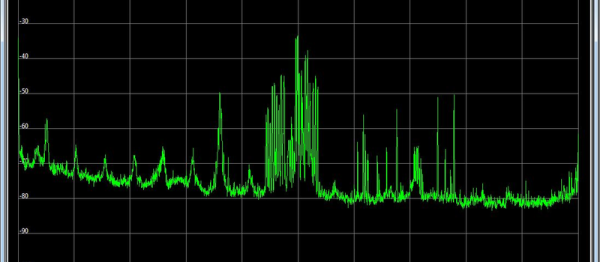
There are definitely drawbacks to this method. The sampling depth of the scope is eight bits, which limits his maximum signal-to-noise ratio, and the number-crunching and data transfer are slow, resulting in a 2 Hz refresh rate. But once the data has made it across to his laptop, [rheslip] can run the FFTs at whatever sample length he wants, resulting in very high frequency resolution.
Indeed, we’re thinking that there’s all sorts of custom filters and analysis that one could do with raw access to the oscilloscope’s data. Why haven’t we been doing this all along? Any of you out there have cool VISA tricks that you’d like to share?
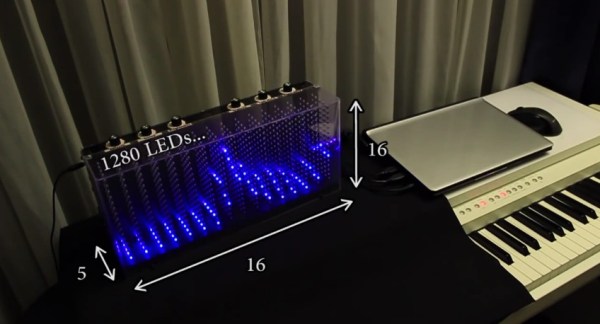
 When [Dooievriend] set out to design the audio analyzing portion of the firmware, his mind jumped to the discrete Fourier transform. This transform calculates the amplitude in a series of frequency bins in the audio—seemingly perfect for a VU. However, after some more research, [Dooievriend] decided to implement a


