Scope GUI Made Easier

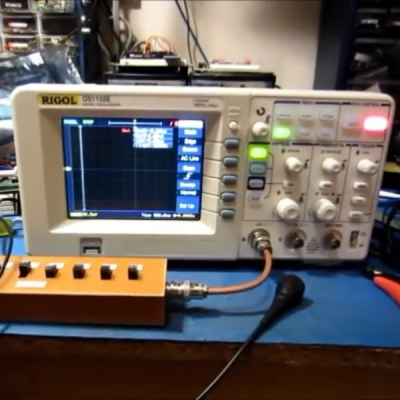
Last time, I assembled a Python object representing a Rigol oscilloscope. Manipulating the object communicates with the scope over the network. But my original goal was to build a little GUI window to sit next to the scope’s web interface. Had I stuck with C++ or even C, I would probably have just defaulted to Qt or maybe FLTK. I’ve used WxWidgets, too, and other than how many “extra” things you want, these are all easy enough to use. However, I had written the code in Python, so I had to make a choice.

Granted, many of these toolkits have Python bindings — PyQt, PySide, and wxPython come to mind. However, the defacto GUI framework for Python is Tkinter, a wrapper around Tk that is relatively simple to use. So, I elected to go with that. I did consider PySimpleGUI, which is, as the name implies, simple. It is attractive because it wraps tkinter, Qt, WxPython, or Remi (another toolkit), so you don’t have to pick one immediately. However, I decided to stay conservative and stuck with Tkinter. PySimpleGUI does have a very sophisticated GUI designer, though.

About Tkinter

The Tkinter toolkit lets you create widgets (like buttons, for example) and give them a parent, such as a window or a frame. There is a top-level window that you’ll probably start with. Once you create a widget, you make it appear in the parent widget using one of three layout methods:

  1. Absolute or relative coordinates in the container
  2. “Pack” to the top, bottom, left, or right of the container
  3. Row and column coordinates, treating the container like a grid

The main window is available from the Tk() method:

import tkinter as tk
root=tk.Tk()
root.title('Example Program')
button=tk.Button(root, text="Goodbye!", command=root.destroy)
button.pack(side='left')
root.mainloop()

That’s about the simplest example. Make a button and close the program when you push it. The mainloop call handles the event loop common in GUI programs.

Continue reading “Scope GUI Made Easier”

Yet Another Rigol DS1054Z Viewer

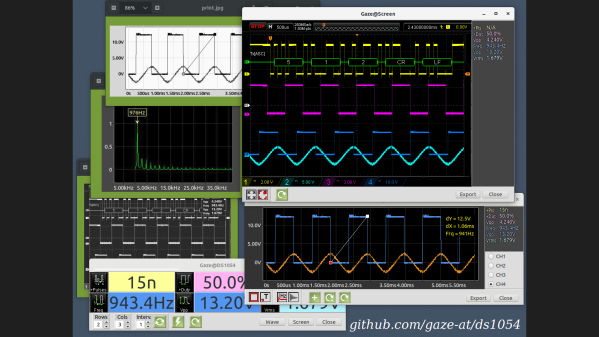
Tired of squinting at the small numbers on the oscilloscope display, [Alfred] aka [Gaze@] decided to take matters into his own hands and wrote yet another tool to remotely view images from a Rigol DS1054Z. At least that was the initial idea. But, it grew unexpectedly — as [Alfred] says, “the more the project turned out to be fun, the more it got out of hand”. We know the feeling well.

In addition to being able to simply view and export the screen, the program implements waveform measurements (we’re not sure if it is using the measurement ability of the ‘scope, or actually performing measurements in the program). And as you can see in the animated GIF of the program in operation over on the GitHub repository, the numbers are certainly clear and legible. His problem of squinting at the small screen has indeed been solved.

This is coded in Pascal (FPC Lazarus), but we weren’t able to browse the program because [Alfred] hasn’t posted the source code yet. It is written only for Linux, and he has tested it on Ubuntu, Debian, Fedora, and Manjaro. The project relies on Python, PyVisa, and gtk2, and talks to your DS1054Z over USB or LAN. The installation instructions are well documented, but as [Alfred] himself warns, if you encounter trouble arising from subtle dependency version conflicts, you may need to be a nerd and/or a pensioner with unlimited time on your hands to solve them. There is no users guide nor extensive help according to [Alfred]. However, simple hints might be found in hover text or by pressing F1. Disclaimers aside, this looks like an interesting project to try out.

As [Alfred] notes, there are many other tools available to fetch data and images from your Rigol oscilloscope. [Jenny List] wrote a two-part series on using Python to control your test instruments, and here’s an example of a simple Python script that does a screen grab. Do you have a favorite way to remotely operate your oscilloscope? Let us know in the comments below.

Controlling Your Instruments From A Computer: Doing Something Useful

Do you know how to harvest data from your bench tools, like plotting bandwidth from your oscilloscope with a computer? It’s actually pretty easy. Many bench tools make this easy using a standard protocol with USB to make the connection.

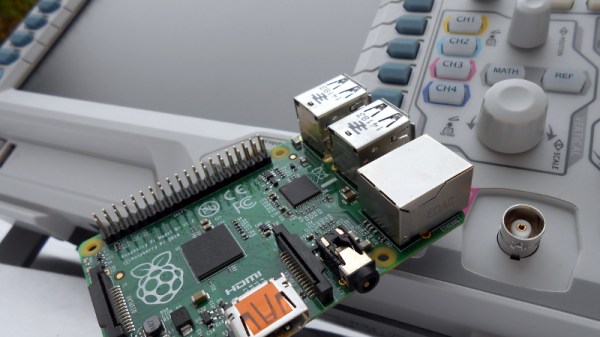
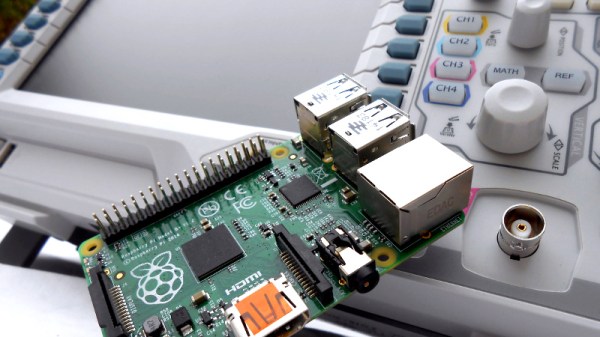
In the previous installment of this article we talked about the National Instruments VISA (Virtual Instrument Software Archetecture) standard for communicating with your instruments from a computer, and introduced its Python wrapper with a simple demonstration using a Raspberry Pi. We’ll now build on that modest start by describing a more useful application for a Raspberry Pi and a digital oscilloscope; we’ll plot the bandwidth of an RF filter. We’ll assume that you’ve read the previous installment and have both Python and the required libraries on your machine. In our case the computer is a Raspberry Pi and the instrument is a Rigol DS1054z, but similar techniques could be employed with other computers and instruments.

Continue reading “Controlling Your Instruments From A Computer: Doing Something Useful”

How To Control Your Instruments From A Computer: It’s Easier Than You Think

There was a time when instruments sporting a GPIB connector (General Purpose Interface Bus) for computer control on their back panels were expensive and exotic devices, unlikely to be found on the bench of a hardware hacker. Your employer or university would have had them, but you’d have been more likely to own an all-analogue bench that would have been familiar to your parents’ generation.

A GPIB/IEEE488 plug. Alkamid [CC BY-SA 3.], via Wikimedia Commons
A GPIB/IEEE488 plug. Alkamid [CC BY-SA 3.], via Wikimedia Commons.
The affordable instruments in front of you today may not have a physical GPIB port, but the chances are they will have a USB port or even Ethernet over which you can exert the same control. The manufacturer will provide some software to allow you to use it, but if it doesn’t cost anything you’ll be lucky if it is either any good, or available for a platform other than Microsoft Windows.

So there you are, with an instrument that speaks a fully documented protocol through a physical interface you have plenty of spare sockets for, but if you’re a Linux user and especially if you don’t have an x86 processor, you’re a bit out of luck on the software front. Surely there must be a way to make your computer talk to it!

Let’s give it a try — I’ll be using a Linux machine and a popular brand of oscilloscope but the technique is widely applicable.

Continue reading “How To Control Your Instruments From A Computer: It’s Easier Than You Think”

No Spectrum Analyser? No Problem!

In the Bad Old Days, a spectrum analyser was a big piece of expensive machinery that you’d have on your bench next to your oscilloscope. And while good ones still cost a ton of money, [rheslip] shows you how to turn your VISA-compatible scope into a decent spectrum analyser for the low, low price of nothing. Watch it in action in the video below the break.

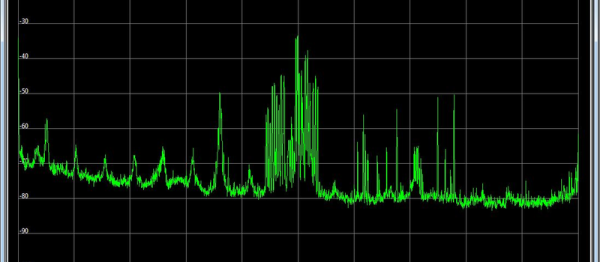
pyvisa-shot0002_tnIf your scope is relatively recent, like this side of the late 1990s, it might support National Instrument’s VISA: virtual instrument software architecture. [rheslip]’s Rigol scope does, and he uses PyVisa, a Python wrapper for the NI-VISA libraries to download the raw samples from the ‘scope and then crunches the FFTs out on his laptop.

There are definitely drawbacks to this method. The sampling depth of the scope is eight bits, which limits his maximum signal-to-noise ratio, and the number-crunching and data transfer are slow, resulting in a 2 Hz refresh rate. But once the data has made it across to his laptop, [rheslip] can run the FFTs at whatever sample length he wants, resulting in very high frequency resolution.

Indeed, we’re thinking that there’s all sorts of custom filters and analysis that one could do with raw access to the oscilloscope’s data. Why haven’t we been doing this all along? Any of you out there have cool VISA tricks that you’d like to share?

Continue reading “No Spectrum Analyser? No Problem!”