Statistics And Hacking: A Stout Little Distribution

Previously, we discussed how to apply the most basic hypothesis test: the z-test. It requires a relatively large sample size, and might be appreciated less by hackers searching for truth on a tight budget of time and money.

As an alternative, we briefly mentioned the t-test. The basic procedure still applies: form hypotheses, sample data, check your assumptions, and perform the test. This time though, we’ll run the test with real data from IoT sensors, and programmatically rather than by hand.

The most important difference between the z-test and the t-test is that the t-test uses a different probability distribution. It is called the ‘t-distribution’, and is similar in principle to the normal distribution used by the z-test, but was developed by studying the properties of small sample sizes. The precise shape of the distribution depends on your sample size. Continue reading “Statistics And Hacking: A Stout Little Distribution”

Statistics And Hacking: An Introduction To Hypothesis Testing

In the early 20th century, Guinness breweries in Dublin had a policy of hiring the best graduates from Oxford and Cambridge to improve their industrial processes. At the time, it was considered a trade secret that they were using statistical methods to improve their process and product.

One problem they were having was that the z-test (a commonly used test at the time) required large sample sizes, and sufficient data was often unavailable. By studying the properties of small sample sizes, William Sealy Gosset developed a statistical test that required fewer samples to produce a reasonable result. As the story goes though, chemists at Guinness were forbidden from publishing their findings.

So he did what many of us would do: realizing the finding was important to disseminate, he adopted a pseudonym (‘Student’) and published it. Even though we now know who developed the test, it’s still called “Student’s t-test” and it remains widely used across scientific disciplines.

It’s a cute little story of math, anonymity, and beer… but what can we do with it? As it turns out, it’s something we could probably all be using more often, given the number of Internet-connected sensors we’ve been playing with. Today our goal is to cover hypothesis testing and the basic z-test, as these are fundamental to understanding how the t-test works. We’ll return to the t-test soon — with real data. Continue reading “Statistics And Hacking: An Introduction To Hypothesis Testing”

AI Beats Poker Pros: Skynet Looms

There have been a few “firsts” in AI-versus-human gaming lately, and the computers are now beating us at trivia, chess and Go. But in some sense, none of these are really interesting; they’re all games of fact. Poker is different. Aside from computing the odds of holding the winning hand, where a computer would obviously have an advantage, the key to winning in poker is bluffing, and figuring out when your opponent is bluffing. Until recently, this has helped man beat the machine. Those days are over.

Chess and Go are what a game theorist would call games of perfect information: everyone knows everything about the state of the game just from looking at the board, and this means that there is, in principle, a best strategy (series of moves) for every possible position. Granted, it’s hard to figure these out because it’s a big brute-force problem, but it’s still a brute-force problem where computers have an innate advantage. Chess and Go are games where the machines should be winning.  Continue reading “AI Beats Poker Pros: Skynet Looms”

Show Me The Data: Hackaday.io Year #02

Hackaday.io has just turned two today and we couldn’t be more excited about how far we’ve come. What started out as a simple proof-of-concept, inspired by ye-olde idea of a “virtual hackerspace,” has truly evolved into a global playground for some of the best, brightest, and most creative minds you have ever met. It also became a home and the place to spend sleepless nights for many of us on the team, and we’re excited to share a few ideas on where we are headed going forward.

But before we do that, let’s look at some data.

The Data

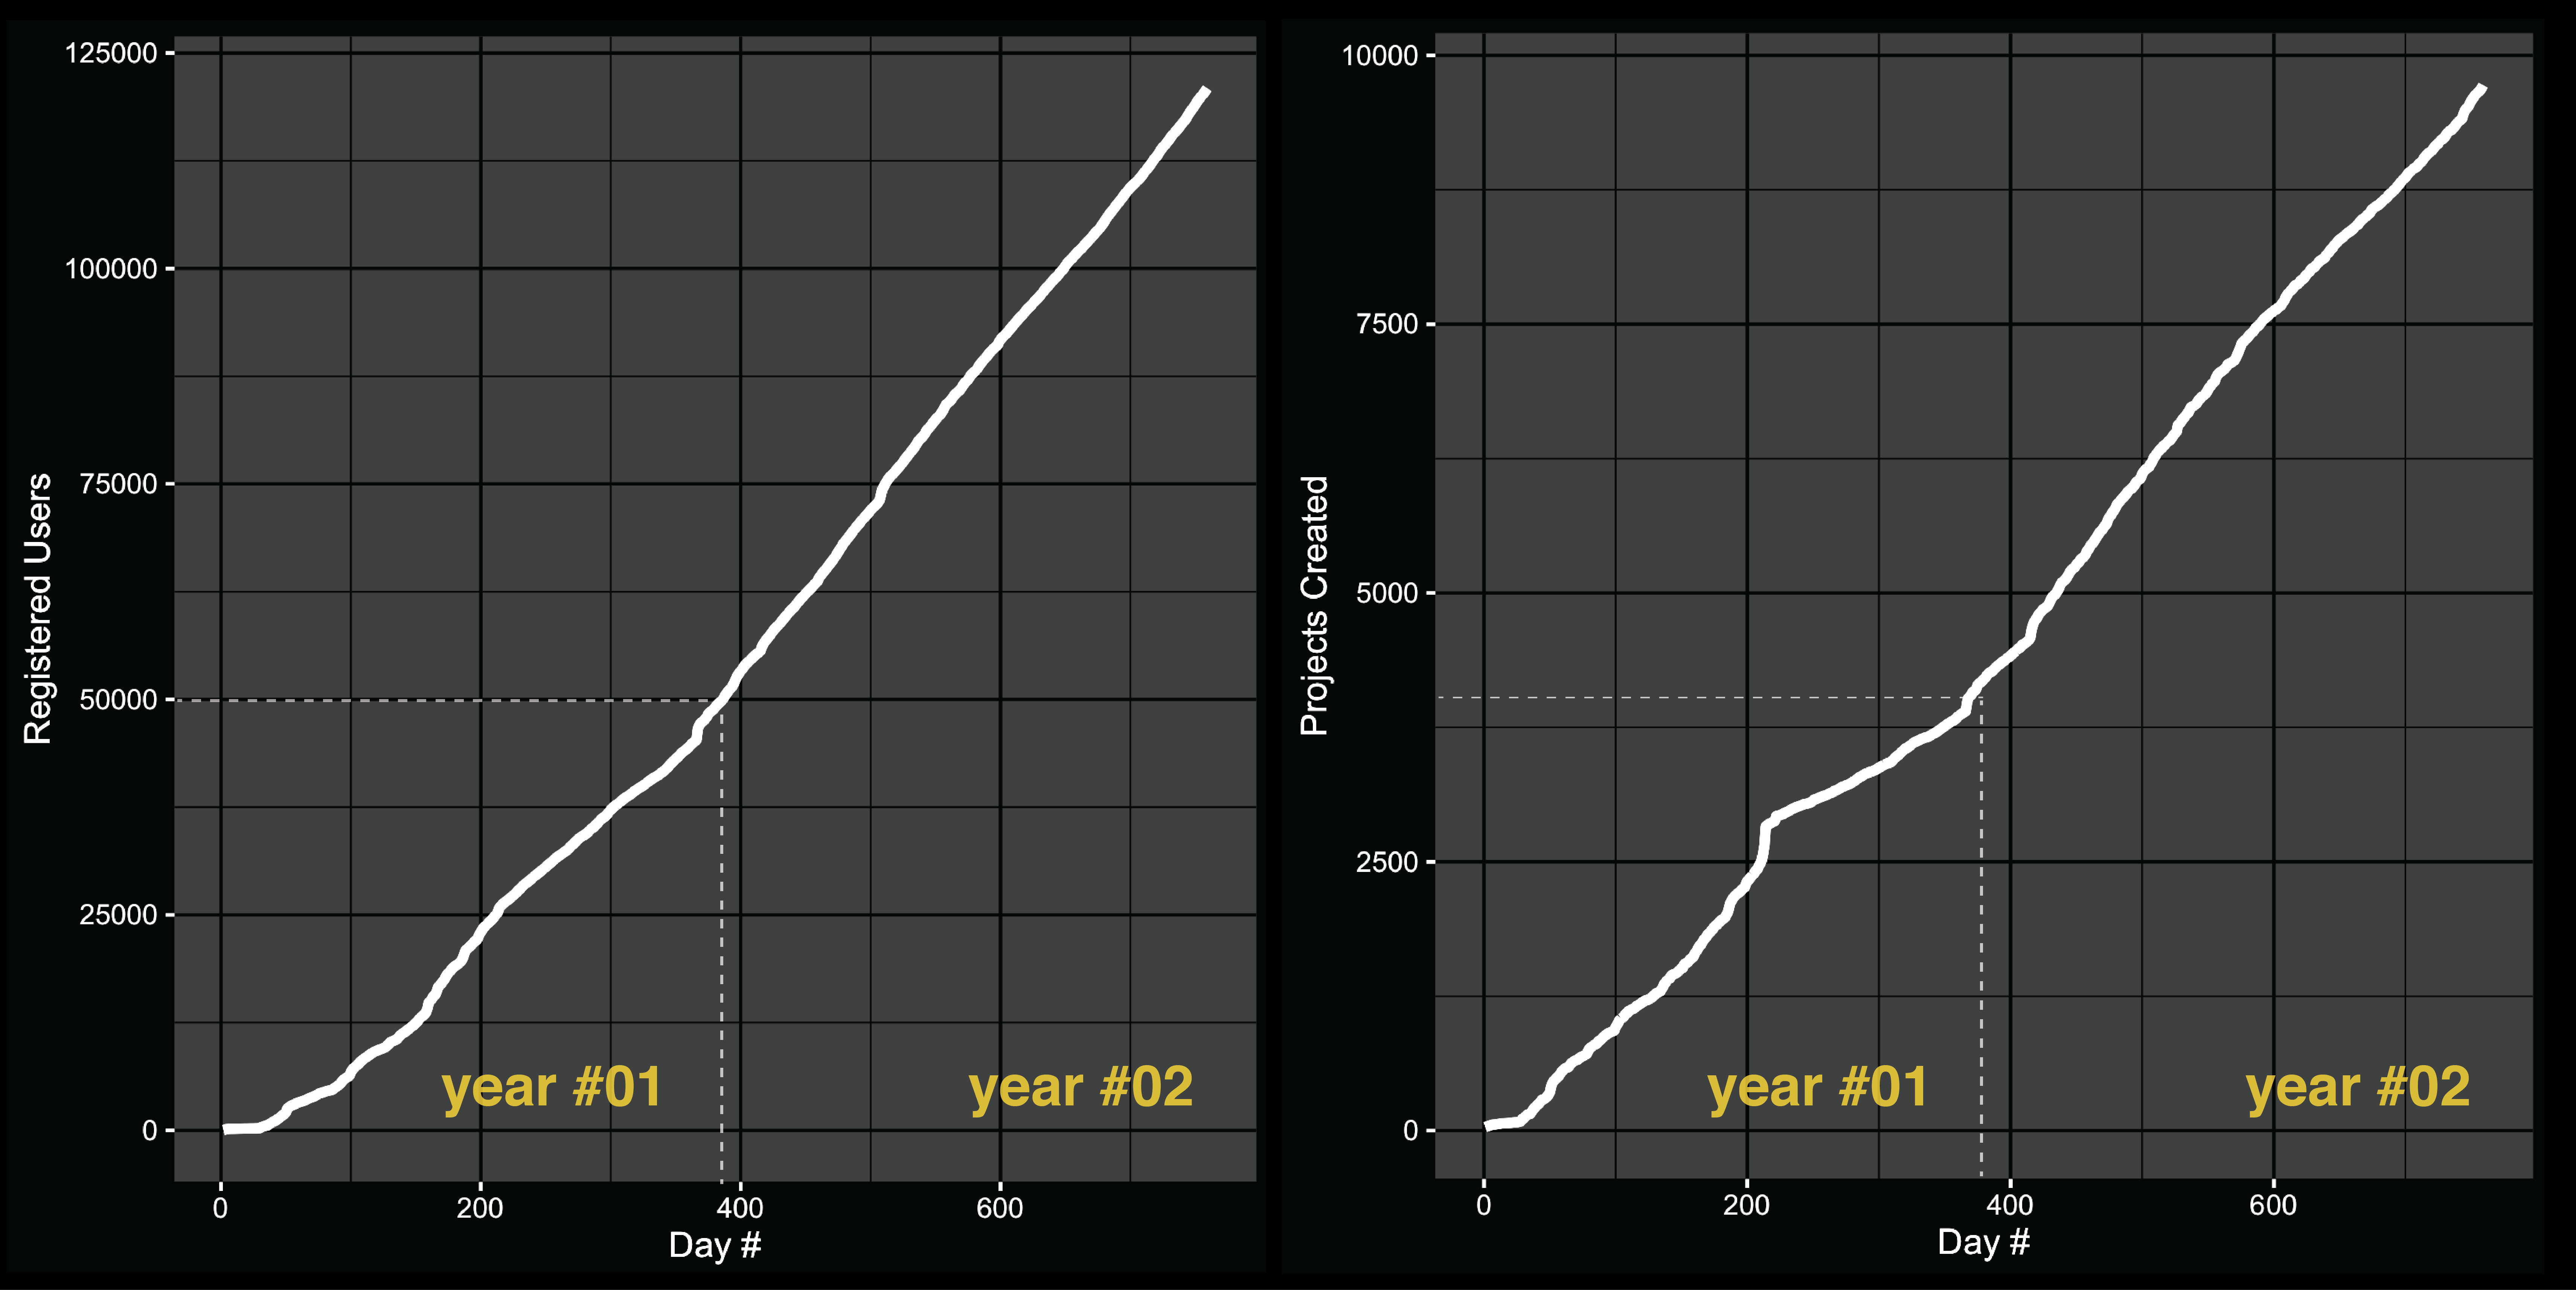
We’re thrilled to report that over the last two years, Hackaday.io has grown from zero to a 121,158-member strong community, who have together created a total of 9,736 projects. To put this in context, it is more than a two-fold growth from last year’s milestone of 51,838 users / 4,365 projects. And it doesn’t seem to be showing any signs of slowing down.

regusers_projects5

Projects

Though these “vanity” metrics sure are a nice validation, the number that gets us the most excited is the fact that the 9,731 projects currently on the site have been created by a total 4,966 different users. What’s even better is the fact that 949 projects are a result of collaboration between two or more people. Altogether, a total of 7,170 different users have participated in the creation of the vast body of engineering knowledge currently residing on Hackaday.io.

Continue reading “Show Me The Data: Hackaday.io Year #02”

Beating The Casino: There Is No Free Lunch

When you are a hardware guy and you live in a time of crisis, sooner or later you find yourself working for some casino equipment company. You become an insider and learn a lot about their tricks. I’ve been in touch with that business for about 30 years. I made a lot of projects for gambling machines which are currently in use, and I had a lot of contact with casino people, both owners and gamblers.

Now I’m sure you expect of me to tell you about the tricks they use to make you spend your money. And I will: there are no technical tricks. This isn’t because they are honest people, but because they don’t need it. Mathematics and Psychology do all the work.

Does the risk of gambling pay off? Mathematically speaking, no – but it’s up to you to decide for yourself. One thing is for certain – whether you decide to gamble or not, it’s good to know how those casino machines work. Know thy enemy.

Continue reading “Beating The Casino: There Is No Free Lunch”

Automated Die Testing

Are the contents of a Crown Royal bag fair? No, they never are. What about dice? In a quest for good randomness, [Apo] designed and built an automated die tester. Not only does it shake the die up, it captures images so real, actual statistics can be done on each individual die.

The setup is a n acrylic box made with BoxMaker attached to a 3D printed adapter for a stepper motor shaft. Randomizing the die happens exactly like you think it would: a stepper shakes the box, and a camera underneath takes a picture. With a bit of computer vision, this image can be translated into a number, ready for the statistics package of your choice.

There were only 559 rolls before the 3D printed mess of duck tape fell apart, but a test of the distribution revealed this die to have a 92% probability that it is fair. That’s not good.

Creating a cheating die is much more interesting, and to find out if he could do it, [Apo] stuck a die in an oven at 100° C for a few minutes. Surprisingly, the fairness of the die got better, suggesting it’s possible to correct an un-fair die. Putting it back in the oven after that threw the fairness out of the window but there was still no visual difference between this modified die and the original stock die.

Hacking High School Exams And Foiling Them With Statistics

graph

A few weeks ago, [Debarghya Das] had two friends eagerly awaiting the results of their High School exit exams, the ISC national examination, taken by 65,000 12th graders in India. This exam is vitally important for each student’s future; a few points determines which university will accept you and which will reject you. One of [Debraghya]’s friends was a little anxious about his grade and asked if it was possible to hack into the board of education’s servers to see the grades before they were posted. [Debraghya] did just that, and was able to download the exam records of nearly every student that took the test.. Looking even closer at the data, he also found evidence these grades were changed in some way.

Getting the grades off the CISCE board of education’s servers was very simple; each school has a separate code, and each student is given an individual number. With the simplest javascript magic, [Debraghya] discovered that individual grades could be accessed by pointing a script to /[4 digit school ID]/[3 digit student ID] on the CISCE server. There was absolutely no security here, an impressive oversight indeed.

After writing a small script and running it on a few machines, [Debraghya] had the exam results, names, and national IDs of 65,000 students. Taking a closer look at the data, he plotted all the scores and came up with a very strange-looking graph (seen above). It looked like a hedgehog, when nearly any test with a population this large should be a continuous curve.

[Debraghya] is convinced he’s discovered evidence of grade tampering. Nearly a third of all possible scores aren’t represented in the data, but scores from 94 to 100 are accounted for, making the hedgehog shape of the graph statistically impossible. Of course [Debraghya] only has the raw scores, and doesn’t know exactly how the tests were scored or how they were manipulated. He does know the scores were altered, though, either through normalizing the raw scores or something stranger and more sinister.

While scraping data off an unencrypted server isn’t much of a hack, despite what the news will tell you, we’re awfully impressed with [Debraghya]’s analysis of the data and his ability to blow the whistle and put this data out in the open. Without any information on how these scores were changed, it doesn’t really change anything, and we’ll welcome any speculation in the comments.