Retrotechtacular: The Fourier Series

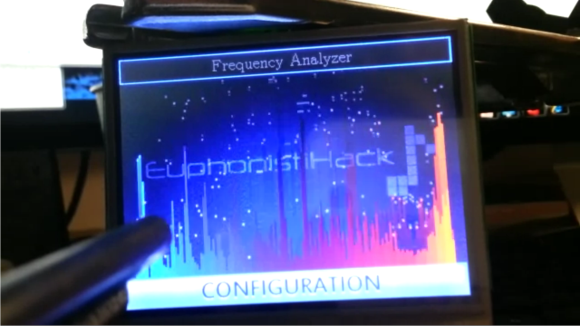
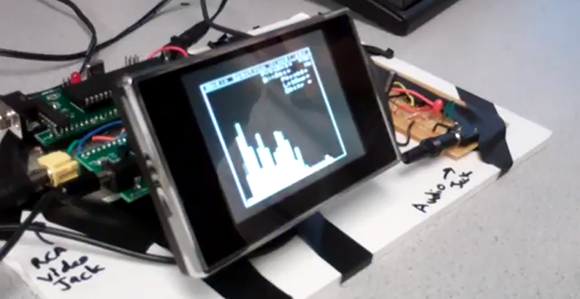
Here’s a really quick video which takes a different approach to understanding the Fourier Series than we’re used to. If you’re a regular reader we’re sure you’ve heard of the Fourier Series (often discussed as FFT or Fast Fourier Transform), but there’s a good chance you know little about it. The series allows you to break down complex signals (think audio waves) into combinations of simple sine or cosine equations which can be handled by a microcontroller.

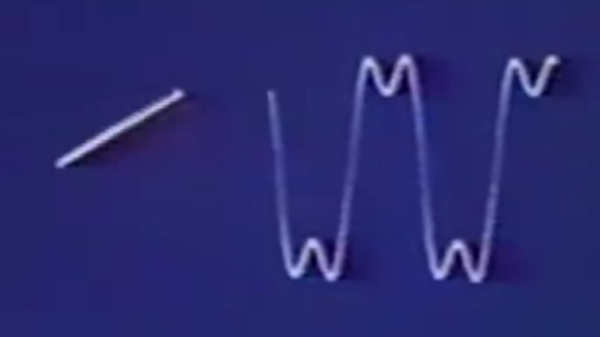
We’ve had that base level of understanding for a long time. But when you start to dig deeper we find that it becomes a math exercise that isn’t all that intuitive. The video clip embedded after the break changes that. It starts off by showing a rotating vector. Mapping the tip of that vector horizontally will draw the waveform. The Fourier Series is then leveraged, adding spinning vectors for the harmonics to the tip of the last vector. The result of summing these harmonics produces the sine-based square wave approximation seen above.

That’s a mouthful, and we’re sure you’ll agree that the video demo is much easier to understand. But the three minute clip just scratches the surface. If you’re determined to master the Fourier Series give this mammoth Stanford lecture series on the topic a try.

Continue reading “Retrotechtacular: The Fourier Series”

Magic Eye Spectrum Analyzer

its goddamned magic


If Nixies aren’t cool enough, maybe it’s time to step it up to magic eye tubes.

Magic eye tubes are, like Nixies and Dekatrons, display tubes. Unlike the alphanumeric characters of Nixies or rotating points of light in a Dekatron, Magic eye tubes are either bar graph or ‘Pac-Man’ displays that were used to show the signal strength of a radio station on very expensive radio sets.

After doing a few experiments with tubes, [sylvain] thought it would be cool to do something with magic eye tubes. He sourced eight vertical ‘bar graph’ magic eye tubes and built an audio spectrum analyzer.

One of the more difficult things to do was to compute the power levels for each frequency band. There are a few graphic equalizer ICs available, but [sylvian] decided to go the old-school, harder way by putting an FFT algorithm on an ATMega624.

An impressive piece of work that would look amazing next to a nice tube stereo system.

Stellaris Launchpad And Booster Packs Used As Frequency Analyzer

stellaris-frequency-analyzer-using-booster-packs

[Jordan Wills] got tired of being limited to eight pixels of resolution and having jumper wires littering his work space. He set out to upgrade his Stellaris Launchpad frequency analyzer project using booster packs. You may remember the initial iteration of the project which used an 8×8 LED matrix to map audio spectrum. With this upgrade he’s really putting the power of that ARM chip to use.

His first improvement with this project was to spin his own audio input board. It has a standard headphone jack for input and a few passive components to shift the signals to rest nicely within the ADC measurement range. The shield has two double pin headers and a group of four stand offs to serve as legs. This way it plugs into the female headers on the bottom of the Launchpad and provides a stable base for the assembly.

The second portion of the setup is an LCD booster pack for the hardware. Kentec manufactures this 3.5″ 320×240 LCD (EB-LM4F120-L35) complete with a resistive overlay making it touch sensitive. The increase in resolution, and availability of different colors gave [Jordan] plenty to work on. Since this add-on is designed for the Launchpad and has a driver library already available he was able to focus on adapting the FFT output for display and adding in new features. Don’t miss seeing what he’s accomplished in the clip after the break.

Continue reading “Stellaris Launchpad And Booster Packs Used As Frequency Analyzer”

Building A Spectrum Analyzer With Parallel Processing

fft

It’s the end of the semester for [Bruce Land]’s microcontroller design class at Cornell, and the projects coming off the workbench this semester look as awesome as any before. For their final project, [Alexander Wang] and [Bill Jo] designed an audio frequency spectrum analyzer using two microcontrollers in a parallel setup.

This spectrum analyzer takes an audio signal from an iPod, phone, or CD player through a 3.5 mm jack and displays the level for dozens of frequency bands much like an audio visualizer in iTunes or a nice car stereo display. To display these frequency bands, the spectrum analyzer first needs to perform a Fast Fourier Transform on the incoming audio signal. While FFT is extremely fast, the calculations are rather hardware intensive; calculating the frequencies and displaying them on a TV would be a bit much even for the ATMega1284 used in the project.

To graph the audio signal on their small display, [Alexander] and [Bill] broke the build up into two parts – one to do the math on the audio, and another to generate the NTSC video signal for the display.

As seen in the video after the break, the spectrum analyzer works wonderfully, and even though it only functions up to 4kHz, it’s more than enough to see what’s going on in most music.

Continue reading “Building A Spectrum Analyzer With Parallel Processing”

Color LED Matrix VU Meter Shows How To Use FFT With Arduino

If you’ve ever wanted to make your own VU meter but were scared off by the signal process you need to study this tutorial.

Hackaday Alum [Phil Burgess] developed the device using an RGB LED matrix, microphone, and an Arduino. You’ll notice that is doesn’t include an MSGEQ7 chip which we see in most of these types of projects. We have seen a few that use the Fast Fourier Transform to map the audio signal on the display as this one does. But [Phil’s] choice of an assembly language Library for ATmega chips makes this really simple to roll into your own projects.

The one drawback to the hardware choices made here is that there are only eight bits of vertical resolution. It takes a little creative interpretation to make this look good, but the use of color mixing really makes a difference. See for yourself in the demo after the break.

Continue reading “Color LED Matrix VU Meter Shows How To Use FFT With Arduino”

Hackaday Links: November 29th, 2012

EMC2 CNC keyboard labels

If you’ve got a dedicated computer running EMC2 for CNC control you may be interested in these keyboard labels. [Rich] mentions that they use the labels for their engraver at the Connecticut Hackerspace. Just print them out and glue them in the face of the keys.

Dev board seminars and freebies

[Mike] wrote in to tell us STM is giving away samples of the STM32 F3 Discovery again. But you can also get in on some free seminars. One is an online webinar for TI’s Launchpad family, the other is for the F3 Discovery board and is being held all around the US.

Replacing batteries with USB power

[Johan] didn’t want to use batteries for the light on the microscope he uses when working with SMT parts. He added a few components with let him power the device from USB instead.

MSP430 VU meter uses FFT

Here’s an MSP430 using Fast Fourier Transform for signal processing. There’s very little explanation, but apparently this collection of FFT related material was used heavily in the project. [via Reddit]

Cell Racr

If you’re looking for a new office game you might consider Cell Racr. It pits your cellphone’s vibrating motor against everyone else’s. Just place the phone on an incline and repeatedly dial its number to advance toward the finish line.

Making An Audio Spectrum Analyzer With A Microcontroller

While [Vinod] says he’s not an expert in this sort of thing, we really like his audio spectrum analyzer build from a simple microcontroller and LCD display.

It is a well-studied fact that every audio waveform – a recording of your voice, for instance – is just the sum of many, many sine waves. These sine waves can be plucked out using Fourier analysis, using a Discrete Fourier transform. This is the principle that spectrum analyzers operate under; [Vinod] wrote a bit of code using DFT to take apart audio captured from a microphone and output their frequency on an LCD display.

To output the spectrum on his LCD, [Vinod] stacked horizontal bars up into 8 custom characters in his display. Like [Vinod]’s previous audio on an ATMega32 experiment, an LM324 amplifier is connected to the ATMega through an analog pin. [Vinod] has a very clever build on his hands with his spectrum analyzer, and a great answer to the perennial ‘how do I build a guitar tuner’ questions we’re constantly asked.

After the break, you can see [Vinod]’s spectrum analyzer in action. Be forewarned; you may want to turn down the volume.

Continue reading “Making An Audio Spectrum Analyzer With A Microcontroller”