Spectrum Analyzer Buyer’s Guide

Having a scope in a home lab used to be a real luxury, but these days, its fairly common for the home gamer to have a sophisticated storage scope (or two) hanging around. Dedicated spectrum analyzers are a bit less common, but they have also dropped in price while growing in capabilities. Want to buy your very own spectrum analyzer? [Kiss Analog] has a buyer’s guide for what to consider.

If you’ve already got a scope, it may have a Fast Fourier Transform (FFT) function, and he talks about how it could be used in place of a spectrum analyzer or vice versa. But it really depends on what you’re planning on using it for. If you’re doing compliance testing for emissions, an analyzer is invaluable. If you like building transmitters or even just oscillators for other purposes, viewing the output on a spectrum analyzer can show you how well or poorly your design is performing. Any application where you need to visualize large swaths of the RF spectrum is a candidate for a spectrum analyzer.

Towards the end of the video, you’ll get to see some actual uses on a Uni-T UTS3021B. While those are at the higher end of the hobby price spectrum (no pun intended), it has many features that would have required an instrument ten times that price in years gone by.

There are also some very inexpensive options out there. While it is true, to a degree, that you get what you pay for, it is also true that even these cheap options would be amazing to an engineer from the 1990s. Yes, of course. You could do it with a 555.

Continue reading “Spectrum Analyzer Buyer’s Guide”

Putting The Magic Smoke Back Into A Dodgy Spectrum Analyzer

The trouble with fixing electronics is that most devices are just black boxes — literally. Tear it down, look inside, but it usually doesn’t matter — all you see are black epoxy blobs, taunting you with the fact that one or more of them are dead with no external indication of the culprit.

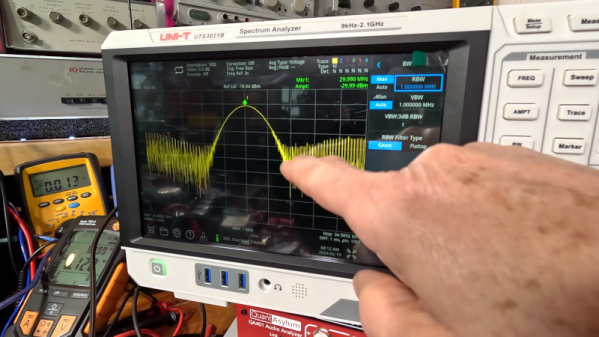
Sometimes, though, you get lucky, as [FeedbackLoop] did with this Rigol spectrum analyzer fix. The instrument powered up and sort of worked, but the noise floor was unacceptably high. Even before opening it up, there was clearly a problem; in general, spectrum analyzers shouldn’t rattle. Upon teardown, it was clear that someone had been inside before and got reassembly wrong, with a loose fastener and some obviously shorted components to show for it. But while the scorched remains of components made a great place to start diagnosis, it doesn’t mean the fix was going to be easy.

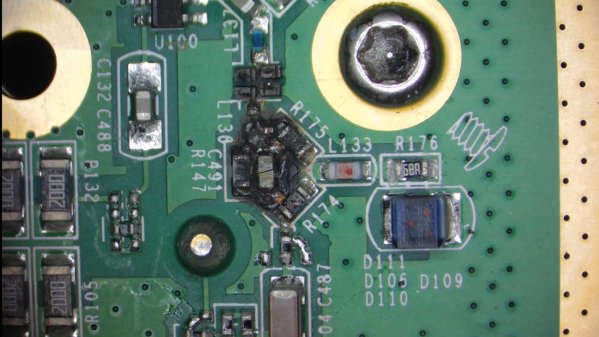
Figuring out the values of the nuked components required a little detective work. The blast zone seemed to once hold a couple of resistors, a capacitor, a set of PIN diodes, and a couple of tiny inductors. Also nearby were a pair of chips, sadly with the markings lasered off. With some online snooping and a little bit of common sense, [FeedbackLoop] was able to come up with plausible values for most of these — even the chips, which turned out to be HMC221 RF switches.

Cleaning up the board was a bit of a chore — the shorted components left quite a crater in the board, which was filled with CA glue, and a bunch of missing pads. This called for some SMD soldering heroics, which sadly didn’t fix the noise problem. Replacing the two RF switches and the PIN diodes seemed to fix the problem, albeit at the cost of some loss. Sometimes, good enough is good enough.

This isn’t the first time [FeedbackLoop] has gotten lucky with choice test equipment in need of repairs — this memory module transplant on a scopemeter comes to mind.

Continue reading “Putting The Magic Smoke Back Into A Dodgy Spectrum Analyzer”

An aluminium case with a small PCB and two nine-volt batteries inside

A Low-Noise Amplifier To Quantify Resistor Noise

Noise is all around us, and while acoustic noise is easy to spot using our ears, electronic noise is far harder to quantify even with the right instruments. A spectrum analyzer is the most convenient tool for noise measurements, but also adds noise of its own to whatever signal you’re looking at. [Limpkin] has been working on measuring very small noise signals using a spectrum analyzer, and shared his results in a comprehensive blog post.

The target he set himself was to measure the noise produced by a 50 Ohm resistor, which is the impedance most commonly seen on the inputs and outputs of RF systems. The formula for Johnson-Nyquist noise power tells us that the expected noise voltage in a one-hertz bandwidth is just 0.9 nanovolts – tiny by any standard, and an order of magnitude smaller than the noise floor of a typical spectrum analyzer. [Limpkin] therefore designed an amplifier and signal buffer to crank up the noise signal by a factor of 100, using ultra-low noise op amps running off a pair of nine-volt batteries.

There was a problem with this circuit, however: any stray DC voltage present at its input would also be amplified to levels that could damage the analyzer’s sensitive input port. To prevent this, [Limpkin] decided to add a clipper circuit to his amplifier. This consists of a pair of comparators that continuously monitor the amplifier’s output voltage and disconnect it through a silicon switch if it goes beyond 200 millivolts. [Limpkin] packaged his circuit in a beautifully-machined case and ran various tests to ensure the clipper worked reliably even in the presence of fast input transients.

With the clipper in place, it was safe to run the planned noise measurements. The end result? About 0.89 nV, just as predicted by theory. Measuring nanovolt-level signals usually requires extremely accurate equipment and lots of tricks to minimize noise. Sometimes though, noise is just what you need to make a radio transmitter. Thanks for the tip, [alfonso32]!

A bench setup with a spectrum analyzer and a PCB under test

Clever Test Rig Clarifies Capacitor Rules-of-Thumb

If you’ve done any amount of electronic design work, you’ll be familiar with the need for decoupling capacitors. Sometimes a chip’s datasheet will tell you exactly what kind of caps to place where, but quite often you’ll have to rely on experience and rules of thumb. For example, you might have heard that you should put 100 µF across the power supply pins and 100 nF close to each chip. But how close is “close”? And can that bigger cap really sit anywhere? [James Wilson] has been doing research to get some firm answers to those questions, and wrote down his findings in a fascinating blog post.

A PCB used to measure the effect of capacitor placement
The test board has two-layer and four-layer sections. The inter-layer capacitance greatly affects the PDN’s performance in each case.

[James] designed a set of circuit boards that enabled him to place different types of capacitors at various distances along a set of PCB traces. By measuring the impedance of such a power distribution network (PDN) across frequency, he could then calculate its performance under different circumstances.

The ideal tool for those measurements would have been a vector network analyzer (VNA), but because [James] didn’t have such an instrument, he made a slightly simpler setup using a spectrum analyzer with a tracking generator. This can only measure the impedance’s magnitude, without any phase information, but that should be good enough for basic PDN characterization.

The results of [James]’s tests are pretty interesting, if not too surprising. For example, those 100 nF capacitors really ought to be placed within 10 mm of your chip if it’s operating at 100 MHz, but you can get away with even 10 cm if no signals go much above 1 MHz. A bulk 100 µF cap can be placed at 10 cm without much penalty in either case. Combining several capacitors of increasing size to get a low impedance across frequency is a good idea in principle, but you need to design the network carefully to avoid resonances between the various components. This is where a not-too-low equivalent series resistance (ESR) is actually a good thing, because it helps to dampen those resonances.

Overall, [James]’s blog post is a good primer on the topic, and gives a bit of much-needed context to those rules of thumb. If you want to dive deeper into the details of PDN design or the inductance of PCB traces, our own [Bil Herd] has made some excellent videos on those topics.

Inspect The RF Realm With Augmented Reality

Intellectually, we all know that we exist in a complex soup of RF energy. Cellular, WiFi, TV, public service radio, radar, ISM-band transmissions from everything from thermometers to garage door openers — it’s all around us. It would be great to see these transmissions, but alas, most of us don’t come from the factory with the correct equipment.

Luckily, aftermarket accessories like RadioFieldAR by [Manahiyo] make it possible to visualize RF signals. As the name suggests, this is an augmented reality system that lets you inspect the RF world around you. The core of the system is a tinySA, a pocket-sized spectrum analyzer that acts as a broadband receiver. A special antenna is connected to the tinySA; unfortunately, there are no specifics on the antenna other than it needs to have a label with an image of the Earth attached to it, for antenna tracking purposes. The tinySA is connected to an Android phone — one that supports Google’s ARCore — by a USB OTG cable, and a special app on the phone runs the show.

By slowly moving the antenna around in the field of view of the phone’s camera, a heat map of signal strength at a particular frequency is slowly built up. The video below shows it in action, and the results are pretty cool. If you don’t have a tinySA, fear not — [Manahiyo] has a version of the app that supports a plain old RTL-SDR dongle too. That should make it easy for just about anyone to try this out.

And if you’re feeling deja vu about this, you’re probably remembering the [Manahiyo]’s VR spectrum analyzer, upon which this project is based.

Continue reading “Inspect The RF Realm With Augmented Reality”

Near Field EMI Probes: Any Good?

[Learnelectronics] purchased some near-field EMI probes for his tiny spectrum analyzer for about $5 on sale. Could they be any good at that price? Watch the video below and find out.

The probes arrived as a kit with four probes: three circular ones for sensing the H field and a stubby probe for sensing E fields (although the video gets this backward, by the way). There’s not much to them, but for the price, it probably isn’t worth making them yourself if your concern is the cost. Now, if you just want to make your own, we get that, too, but don’t expect to save much money.

Continue reading “Near Field EMI Probes: Any Good?”

Say The Magic Word, And The TinySA Goes Ultra

We’ve looked at the TinySA spectrum analyzer in the past. However, the recent Ultra edition offers an increase in range from 800 MHz to 6 GHz. How does it work? [IMSAI Guy] tells us in a recent video that you can watch below. In addition to an increased frequency range, the new device offers a larger display and enhancements to the signal generator and bandpass filtering. It also has an optional LNA. All this, of course, is at a price since the Ultra sells at a little more than twice the original unit’s price. Still, $120 or so for a 6 GHz spectrum analyzer isn’t bad.

For some reason, you have to put a passcode in to enable the Ultra mode, although the passcode appears to be common knowledge and available on the device’s wiki. You can presume they could, at some point, make this feature or others require a paid passcode, but for now, it is just a minor inconvenience. Reminds us of a certain oscilloscope that’s become quite popular in our community.

One thing you should be aware of, however, is that the Ultra mode uses a mixer to downconvert the incoming signal to the ordinary 800 MHz range. That means, as you can see in the video, that the local oscillator puts out some signal at the input. The level is relatively low, but still something to be aware of if you are trying to make a precision measurement.

The video compares the device to an HP 8591E spectrum analyzer. It tops out at 1.8 GHz and runs about $2,500 new. Even on eBay, you can expect to pay between $500 and $1000 for one of these. The results seem to be comparable, for the most part.

We looked at the device’s predecessor back in 2020. We also did a full-blown review a little bit later.

Continue reading “Say The Magic Word, And The TinySA Goes Ultra”