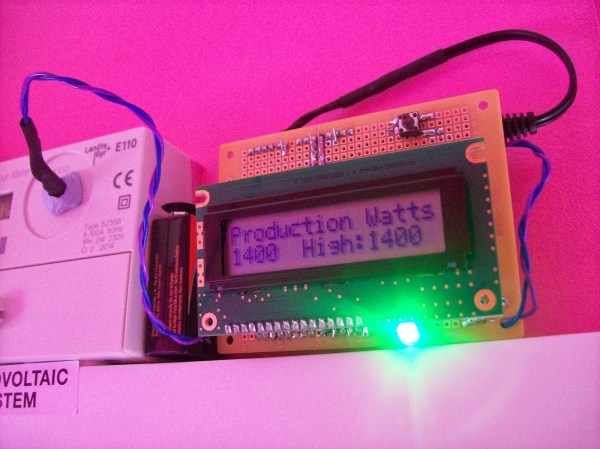
[Carl] recently upgraded his home with a solar panel system. This system compliments the electricity he gets from the grid by filling up a battery bank using free (as in beer) energy from the sun. The system came with a basic meter which really only shows the total amount of electricity the panels produce. [Carl] wanted to get more data out of his system. He managed to build his own monitor using an Arduino.
The trick of this build has to do with how the system works. The panel includes an LED light that blinks 1000 times for each kWh of electricity. [Carl] realized that if he could monitor the rate at which the LED is flashing, he could determine approximately how much energy is being generated at any given moment. We’ve seen similar projects in the past.
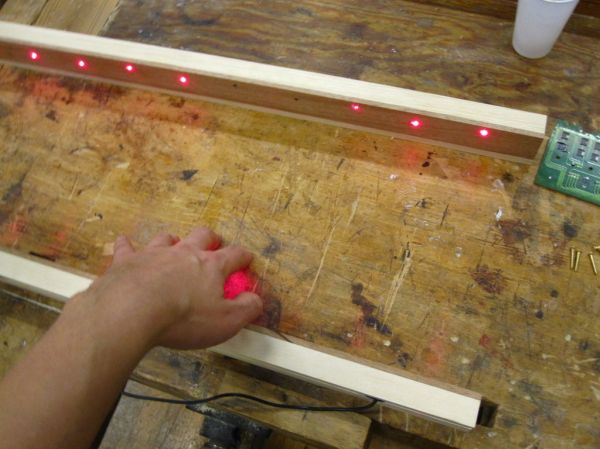
Like most people new to a technology, [Carl] built his project up by cobbling together other examples he found online. He started off by using a sketch that was originally designed to calculate the speed of a vehicle by measuring the time it took for the vehicle to pass between two points. [Carl] took this code and modified it to use a single photo resistor to detect the LED. He also built a sort of VU meter using several LEDs. The meter would increase and decrease proportionally to the reading on the electrical meter.
[Carl] continued improving on his system over time. He added an LCD panel so he could not only see the exact current measurement, but also the top measurement from the day. He put all of the electronics in a plastic tub and used a ribbon cable to move the LCD panel to a more convenient location. He also had his friend [Andy] clean up the Arduino code to make it easier for others to use as desired.


