Instrumentation has progressed by leaps and bounds in the last few years, however, the fundamental analysis techniques that are the foundation of modern-day equipment remain the same. A network analyzer is an instrument that allows us to characterize RF networks such as filters, mixers, antennas and even new materials for microwave electronics such as ceramic capacitors and resonators in the gigahertz range. In this write-up, I discuss network analyzers in brief and how the DIY movement has helped bring down the cost of such devices. I will also share some existing projects that may help you build your own along with some use cases where a network analyzer may be employed. Let’s dive right in.
Network Analysis Fundamentals
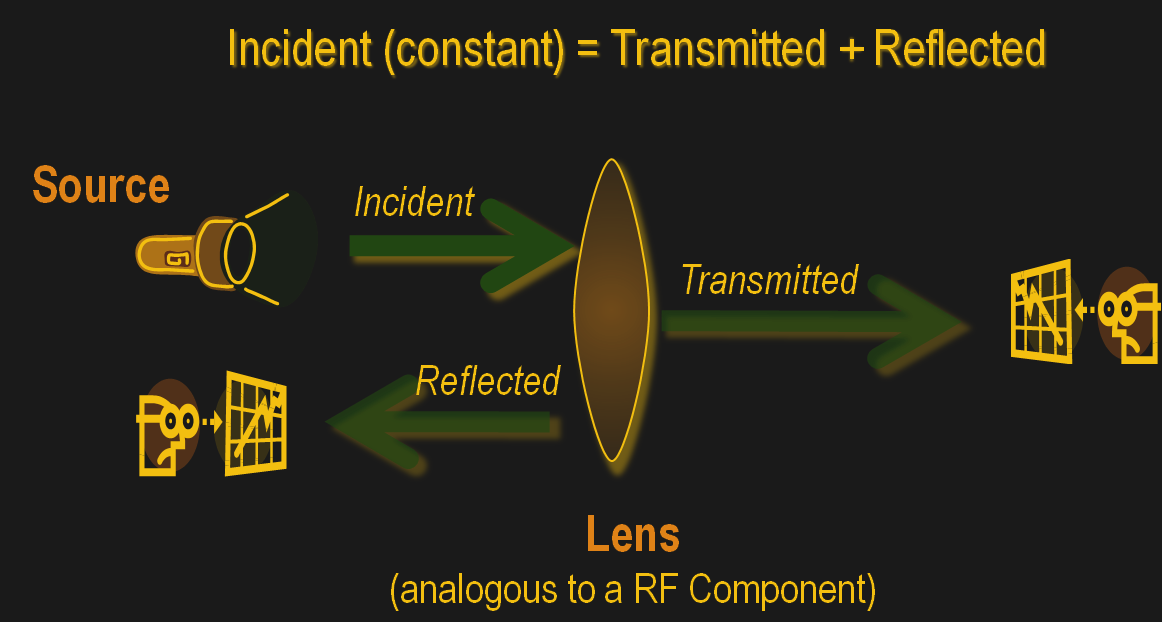 As a conceptual model, think of light hitting a lens and most of it going through but part of it getting reflected back.
The same applies to an electrical/RF network where the RF energy that is launched into the device may be attenuated a bit, transmitted to an extent and some of it reflected back. This analysis gives us an attenuation coefficient and a reflection coefficient which explains the behavior of the device under test (DUT).
Of course, this may not be enough and we may also require information about the phase relationship between the signals. Such instruments are termed Vector Network Analysers and are helpful in measuring the scattering parameters or S-Parameters of a DUT.
The scattering matrix links the incident waves a1, a2 to the outgoing waves b1, b2 according to the following linear equation: 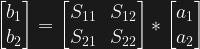
The equation shows that the S-parameters are expressed as the matrix S, where and denote the output and input port numbers of the DUT.
This completely characterizes a network for attenuation, reflection as well as insertion loss. S-Parameters are explained more in details in Electromagnetic Field Theory and Transmission Line Theory but suffice to say that these measurements will be used to deduce the properties of the DUT and generate a mathematical model for the same.
General Architecture
 As mentioned previously, a simple network analyzer would be a signal generator connected and a spectrum analyzer combined to work together. The signal generator would be configured to output a signal of a known frequency and the spectrum analyzer would be used to detect the signal at the other end. Then the frequency would be changed to another and the process repeats such that the system sweeps a range of frequencies and the output can be tabulated or plotted on a graph. In order to get reflected power, a microwave component such as a magic-T or directional couplers, however, all of this is usually inbuilt into modern-day VNAs.
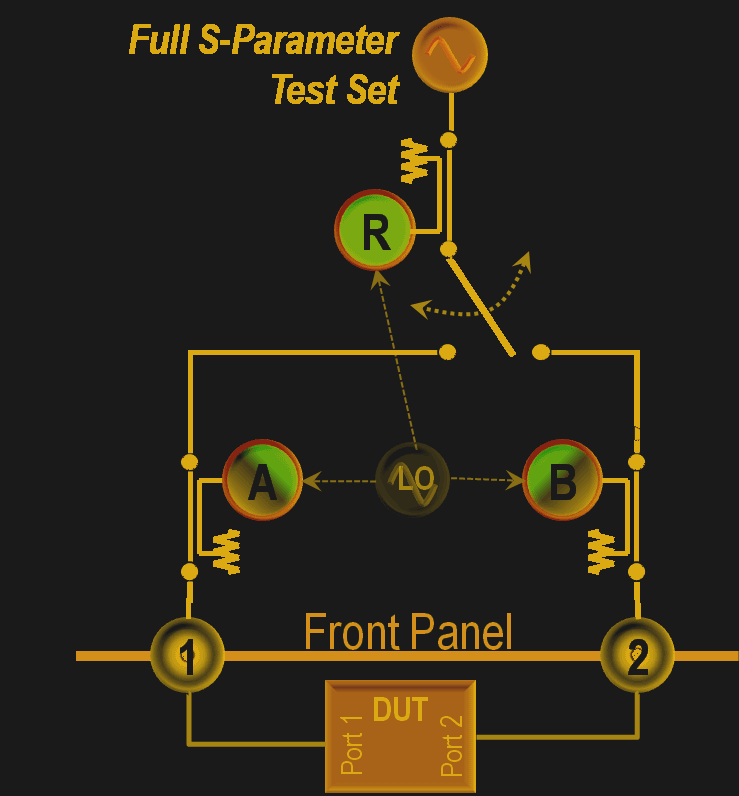
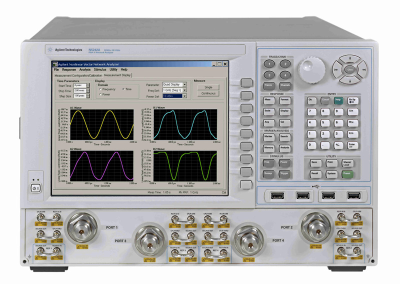
In a laboratory grade VNA, we have two or four ports where a DUT is connected and the software does everything else for you. The only downside is that these instruments are very very expensive and price varies depending upon the range of RF frequencies or RF band coverage.
A DIY Scalar Network Analyzer
Let’s simplify things a bit. Say I have a simple filter I want to characterize in which case phase may not be necessary for my particular applications. I would just like to obtain the frequency-attenuation plot for the circuit so that I can use it correctly. In such cases, the DIY approach is the best and I would like to highlight a project on Hackaday.io for beginners. The idea is simple and involves using the Analog devices AD9851 to generate the desired signals.
The received signal power levels are converted into a voltage using the AD8307 logarithmic amplifier (datasheet, PDF). This voltage is read by a microcontroller and the results, in this case, are plotted using a Python script. Another restriction to this design is the 70 MHz upper limit though it may work for a lot of people getting started with such projects.
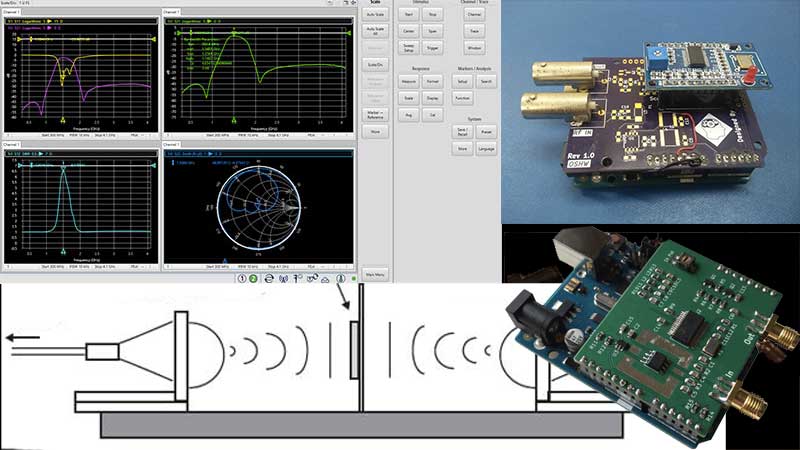
In my quest for a simple experiment, I purchased some AD9850 modules, op-amps, and other tidbits from eBay and made a PCB in KiCAD. I built the project in the Arduino UNO shield layout because my intention was to test it on an Arduino and then move up to an STM32 Nucleo which was also bought on the cheap. My revision 1.0 had some basic bugs so it is still a work in progress but I am sure it will work the same as the above project. Feel free to explore it and make one for yourself. Mine is shown below in OshPark Purple.


I did salvage the connectors from an old DVR board I had lying around so I suggest you replace that footprint with whatever you intend to use in your build.
More serious projects
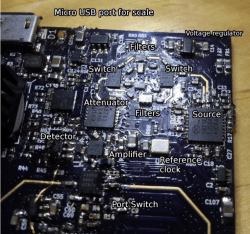 If you are more comfortable with RF circuits and want a more serious project, there is another by [Henrik Forstén] that works from 30 Mhz all the way up to 6 Ghz. The difference here is that his design uses a lot of planning as well as specific RF chips to do the job.
The AD985x is replaced by the MAX2871 and the detector is replaced by an LMH2110. All the files are available on GitHub for our experimentation pleasure though this may not be everyone’s cup of tea. Though if you are getting a little bit interested in this stuff, be sure to check out the website for all the nice info provided.
Vector Network Analysers
 The Vector Network Analyzer is able to generate phase relationships in addition to the magnitude measurements. This allows us to generate complex math models for the components under test and helps identify the capacitive and inductive properties as well. In addition to the above-mentioned applications in the DIY field, VNAs are important tools for analysis of dielectric properties of materials as well. When working with materials such as ceramics in a research environment, a simple method is to apply the silver paste to opposite faces and then use a network analyzer to measure the various parameters. This method is commonly known as capacitance method for measuring complex permittivity.
For higher frequencies where the EM wave needs a waveguide, transmission/reflection methods are preferred. In this method, the material under test is placed inside a waveguide and there is no electrical contact between the terminals and the DUT. This method is commonly called the transmission/reflection line method and is usually employed in the laboratory.
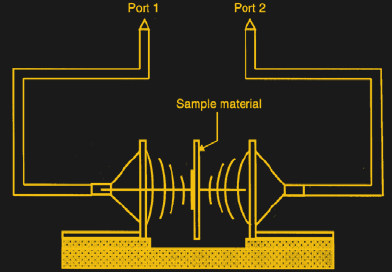 It’s also possible to extend this to make free space measurements, where horn antennas are employed and the DUT is suspended in free space. This allows for the material to be heated or cooled without affecting the instrument or the antennas and is commonly used for temperature analysis of materials.
Measurement Methods for Materials
Once S-parameters are obtained from experiment, this data can then be converted into dielectric properties. Some conversion methods (PDF) are:
- Nicolson-Ross-Weir method,
- NIST iterative method,
- New non-iterative method,
- Short circuit line method.
 The most common parameter evaluated is permittivity or more specifically complex relative permeability (mu-r). The real part is the dielectric constant which is a measure of the amount of energy from an external electrical field stored in the material. The imaginary part is the loss factor and is the amount of energy lost due to external fields. The dielectric constant usually varies with the frequency which means that the same electrolytic capacitor won’t behave the same at all frequencies.
There has been a lot of research invested in creating new materials that will behave favorably at higher frequencies. Today there is a variety of materials being employed to create these devices and research involves characterization of the materials involved.
Another important term is loss tangent (tan delta) and is the ratio of the two. If you are interested in the subject, then I recommend reading the Rhode and Schwarz application note linked just above, as well as papers here and here.
Note: I have not tried to discuss methods like cavity perturbation though it may be of interest to some and can be explored on its own. Take a look at this application note from Keysight (PDF) for more information on the subject.
A short note on VSWR
To complete this write-up, I am going to talk a bit about VSWR which is more associated with antenna and radio setups than materials and VNA. A scalar network analyzer used in HAM radio setups is used to measure a number of things including the Voltage Standing Wave Ratio or VSWR. This parameter is a ratio of energy that was put into an antenna or RF line and the amount of energy that bounced back out of it due to imperfect matching. So essentially, the standing wave ratio (SWR) is a measure of how efficiently RF power is transmitted from the power source, through the transmission line, and into the load. It is ideal to have all the signal converted into RF energy or EM waves at the antenna, however, practically if the impedance of the amplifier and antenna are mismatched, some part will be reflected back just like we discussed in the initial sections. A scalar network analyzer can measure these as well as impedance at various frequencies. RF couplers assist in reducing the mismatch and improving performance in these cases.
What next?
The idea was to explain network analyzers and their applications in brief. You can extend this article by diving into radios and antennas, RF instrumentation, or get into microwave materials for high-frequency applications. For someone working with such materials, a VNA is indispensable as it does the heavy lifting of analysis and presents results in a very straightforward manner.
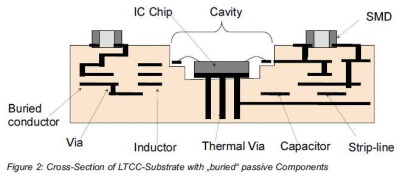
We are moving into ceramics that have a low-temperature coefficient i.e. the dielectric constant remains constant over temperature and LTCC or Low-Temperature Co-fired Ceramics. LTCC allow us to layer components together enabling high-density electronics manufacturing. All that requires analysis which is possible thanks to a combination of advanced instrumentation as well as mathematical algorithms.


A quick note re: your salvaged BNC connectors. If they are from a DVR they are likely the ‘video’ type which is a 75 ohm connector, rather than the usual RF impedance of 50 ohms. They are sort of mechanically compatible but probably not what you want to use! See http://www.wecusurveillance.com/files/891125/uploaded/507hohm.jpg for a quick ‘spotters guide’.
They will be completely mechanically compatible by design, but you are correct, they will present an impedance mismatch.
The center pin is different sizes, so if you mix 50 and 75 ohm connectors you will either have a loose connection or ream out the fingers.
I have 75 ohms cables with dielectric BNCs.
MiniVNA (http://miniradiosolutions.com/54-2/) is quite affordable at about $400, but I don’t know enough about these things to know whether it is any good in practice.
Don’t click that link to Henrik Forstén’s blog – you’ll feel stupid as box of rocks afterwards.
Nice writeup.
While VNAs are still very expensive, it has to be said they they are a damn sight cheaper than they used to be. They used to cost about as much as a house, now you can get a good model from a reputable company for the cost of a second hand car.
It surprises me how much second hand VNAs cost conpared to new and better models. The manufactuers like offer trade ins to keep second hand units off the secondary market.
To append to the list of VNA projects, I’m developing a 2 GHz to 13 GHz open hardware microwave VNA (https://hackaday.io/project/26213-vector-network-analyzer).
No post about the basics of Vector/Scalar Network Analysis is complete without a strong introduction to the Smith Chart. Start here:
https://en.wikipedia.org/wiki/Smith_chart
Also, the concept of Scattering (or S) Parameters deserves equal emphasis:
https://en.wikipedia.org/wiki/Scattering_parameters
Understanding the nomenclature of what an Sxx parameter means in terms of ports and directions is confusing unless you understand the underlying matrix (i.e., linear) algebra that defines the parameters. Simply put: For a passive 2-port network with input on port-1 and output on port-2, S21 is the insertion loss, S11 is the input return loss, S21 is the output (reverse) insertion loss, and S22 is the output return loss.
Finally, never confuse a Scalar Network Analyzer (SNA) with a Vector Network Analyzer.
https://en.wikipedia.org/wiki/Network_analyzer_(electrical)
* scalar network analyzer (SNA)—measures amplitude properties only
* vector network analyzer (VNA)—measures both amplitude and phase properties
An SNA is useful in characterizing/testing against expected performance, not so much in designing networks. A VNA is far more useful, especially in the design phase. When you have both the vector amplitude and phase data, you can design matching networks. An SNA does not give you this information (at least not without jumping through hoops, e.g., slotted/trombone lines and/or calibrated reactive loads, etc.)
Good authors never post pay-walled articles.
“Continue reading –>” please.
This! I swear to god I’m going to write a bot for this at some point. literally HALF the flipping page of blog posts is this article. Lacking a proper opening / hook paragraph and not using “Continue reading ->” is the cancer of the hackaday blog, it makes browsing through articles time consuming and annoying rather than enjoyable
To the actual owners/devs of HAD, PLEASE enforce this pragmatically! blog posts longer than xxx chars should REQUIRE a “Contine Reading ->” to be placed in the first yyy chars
Continue*
I second that motion if – and only if – there actually IS something more to read and not ‘just’ embedded motion pictures.
In the latter case I’d recommend something like “Continue to moving pictures ->”.
“RF couplers assist in reducing the mismatch and improving performance in these cases.” No. A tuner wastes the mismatch as heat. No improvement shall be made.
wastes it with purely reactive components?
I think you’ve got that wrong. A tuner uses reactive components to transform the impedance. An RF directional coupler has no loss, either.
An attenuator used as an isolator can reduce mismatch and is a simple wideband way to get a better match at the expense of wasted power. Is that what you are thinking of?
Going to 6 GHz is very impressive. Unclear what is the dynamic range/sensitivity?
There are a few other open source VNAs out there:
1) Scotty’s spectrum analyzer (can be hacked into a VNA). Goes up to 1 GHz. Good community support.
2) VNWA. Verson 2 was open (but hard to build), version 3 is closed http://sdr-kits.net – inepensive commercial solution that goes up to 1.3 GHz
3) N2PK http://www.makarov.ca/vna.htm – goes up to 500 MHz. Fairly good HAM ommunity around it.