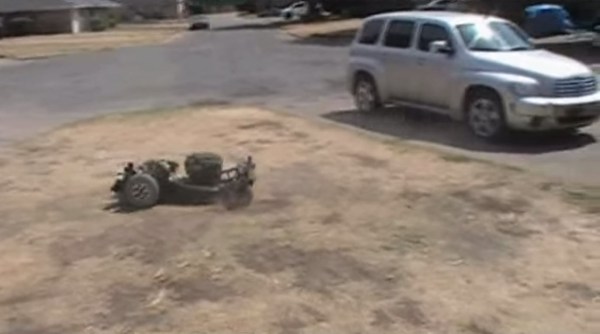
For the last few months, teams across the US have taken old Power Wheels and other electric vehicles meant for children and turned them into racing machines capable of flying around the track at speeds pf over 30 miles per hour. How do you take the plastic chassis of a kid’s toy and turn it into a Power Racer? [Dane] from team Chibi-Atomic-Thing tells us how.
In classic Power Racing Series fashion, this year’s build began with last year’s chassis. At the 2014 NYC Maker Faire, a weld on the steering linkages failed, necessitating some quick work to replace some bad welds. Poor fabrication wasn’t the only shortcoming of last year’s car; the rear axle was fixed, the brakes were terrible, and the gearbox wasn’t quite as good as it could be.
The team had a few months to make the necessary changes for this season’s races. Because they were adding advanced and arcane technology known as a differential this year, a second disc brake holster would need to be fabricated for the other rear wheel. A new motor controller was added, but the team is mum on why exactly they need an eight-speed gearbox when the longest straight on the track is about fifty feet.
The answer to why a tiny electric car needs more gears than a clock is for now, at least, unknown. Hopefully it will be revealed at the next Power Racing Series race at the NYC Maker Faire in a few weeks. Until then, check out the video of the 2015 Detroit race below.