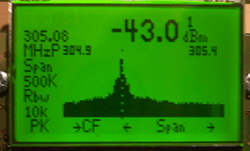
Radio seems to be an unofficial theme for The Hackaday Prize, with a few wireless frameworks for microcontrollers and software defined radios making their way into the quarterfinal selection. [roelh]’s project is a little different from most of the other radio builds. It’s a simple spectrum analyzer, but one that works up to 3GHz.
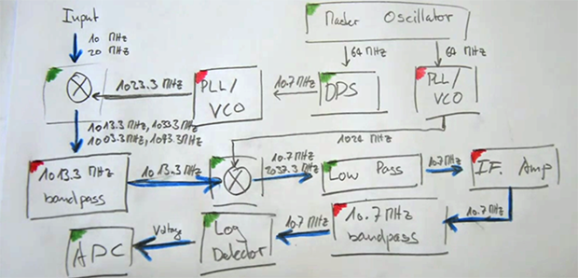
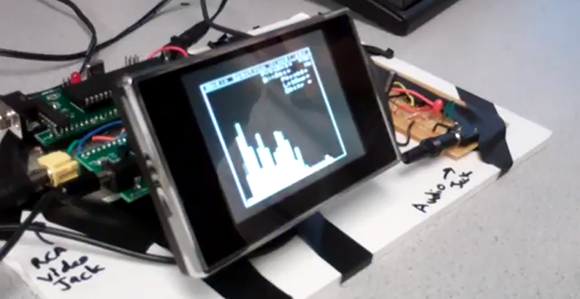
The hardware is a mishmash of chips including an ADL5519 power detector, an Si4012 for the local oscillator, and a MAX2680 mixer. An Atmel XMega takes care of all the on board processing, displaying the spectrum on a small LCD, writing data to an SD card, and sending data over a 3.5mm jack that doubles as either an analog input or a half duplex RS232 port.
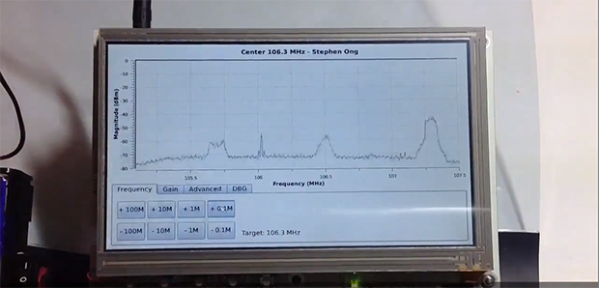
Seen in the video below, [roelh]’s spectrum analyzer is more or less finished, complete with a nice looking enclosure. Now [roelh] is working on documentation, porting his source to English, and getting all the files ready to be judged by our real judges.
 The project featured in this post is a quarterfinalist in The Hackaday Prize.
Continue reading “THP Quarterfinalist: 3GHz Spectrum Analyzer”