Reservoir Sampling, Or How To Sample Sets Of Unknown Size

Selecting a random sample from a set is simple. But what about selecting a fair random sample from a set of unknown or indeterminate size? That’s where reservoir sampling comes in, and [Sam Rose] has a beautifully-illustrated, interactive guide to how reservoir sampling works. As far as methods go, it’s as elegant as it is simple, and particularly suited to fairly sampling dynamic datasets like sipping from a firehose of log events.

While reservoir sampling is simple in principle it’s not entirely intuitive to everyone. That’s what makes [Sam]’s interactive essay so helpful; he first articulates the problem before presenting the solution in a way that makes it almost self-evident.

[Sam] uses an imaginary deck of cards to illustrate the problem. If one is being dealt cards one at a time from a deck of unknown size (there could be ten cards, or a million), how can one choose a single card in a way that gives each an equal chance of having been selected? Without collecting them all first?

In a nutshell, the solution is to make a decision every time a new card arrives: hold onto the current card, or replace it with the new one. Each new card is given a 1/n chance of becoming held, where n is the number of cards we’ve seen so far. That’s all it takes. No matter when the dealer stops dealing, each card that has been seen will have had an equal chance of ending up the one selected.

There are a few variations which [Sam] also covers, and practical ways of applying it to log collection, so check it out for yourself.

If [Sam]’s knack for illustrating concepts in an interactive way is your jam, we have one more to point out. Our own Al Williams wrote a piece on Turing machines; the original “universal machine” being a theoretical device with a read/write head and infinite paper tape. A wonderful companion to that article is [Sam]’s piece illustrating exactly how such a Turing machines would work in an interactive way.

The Guinness Brewery Invented One Of Science’s Most Important Statistical Tools

The Guinness brewery has a long history of innovation, but did you know that it was the birthplace of the t-test? A t-test is usually what underpins a declaration of results being “statistically significant”. Scientific American has a fascinating article all about how the Guinness brewery (and one experimental brewer in particular) brought it into being, with ramifications far beyond that of brewing better beer.

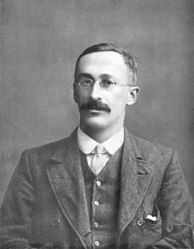
William Sealy Gosset (aka ‘Student’), self-trained statistician. [source: user Wujaszek, wikipedia]
Head brewer William Sealy Gosset developed the technique in the early 1900s as a way to more effectively monitor and control the quality of stout beer. At Guinness, Gosset and other brilliant researchers measured everything they could in their quest to optimize and refine large-scale brewing, but there was a repeated problem. Time and again, existing techniques of analysis were simply not applicable to their gathered data, because sample sizes were too small to work with.

While the concept of statistical significance was not new at the time, Gosset’s significant contribution was finding a way to effectively and economically interpret data in the face of small sample sizes. That contribution was the t-test; a practical and logical approach to dealing with uncertainty.

As mentioned, t-testing had ramifications and applications far beyond that of brewing beer. The basic question of whether to consider one population of results significantly different from another population of results is one that underlies nearly all purposeful scientific inquiry. (If you’re unclear on how exactly the t-test is applied and how it is meaningful, the article in the first link walks through some excellent and practical examples.)

Dublin’s Guinness brewery has a rich heritage of innovation so maybe spare them a thought the next time you indulge in statistical inquiry, or in a modern “nitro brew” style beverage. But if you prefer to keep things ultra-classic, there’s always beer from 1574, Dublin castle-style.

Say It With Me: Aliasing

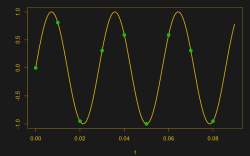
Suppose you take a few measurements of a time-varying signal. Let’s say for concreteness that you have a microcontroller that reads some voltage 100 times per second. Collecting a bunch of data points together, you plot them out — this must surely have come from a sine wave at 35 Hz, you say. Just connect up the dots with a sine wave! It’s as plain as the nose on your face.

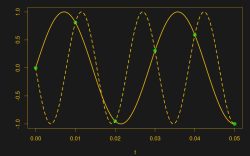
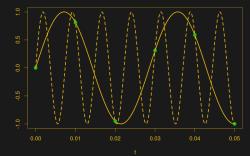
And then some spoil-sport comes along and draws in a version of your sine wave at -65 Hz, and then another at 135 Hz. And then more at -165 Hz and 235 Hz or -265 Hz and 335 Hz. And then an arbitrary number of potential sine waves that fit the very same data, all spaced apart at positive and negative integer multiples of your 100 Hz sampling frequency. Soon, your very pretty picture is looking a bit more complicated than you’d bargained for, and you have no idea which of these frequencies generated your data. It seems hopeless! You go home in tears.

But then you realize that this phenomenon gives you super powers — the power to resolve frequencies that are significantly higher than your sampling frequency. Just as the 235 Hz wave leaves an apparent 35 Hz waveform in the data when sampled at 100 Hz, a 237 Hz signal will look like 37 Hz. You can tell them apart even though they’re well beyond your ability to sample that fast. You’re pulling in information from beyond the Nyquist limit!

This essential ambiguity in sampling — that all frequencies offset by an integer multiple of the sampling frequency produce the same data — is called “aliasing”. And understanding aliasing is the first step toward really understanding sampling, and that’s the first step into the big wide world of digital signal processing.

Whether aliasing corrupts your pristine data or provides you with super powers hinges on your understanding of the effect, and maybe some judicious pre-sampling filtering, so let’s get some knowledge.

Continue reading “Say It With Me: Aliasing”

Pulling Music Out Of The Airwaves

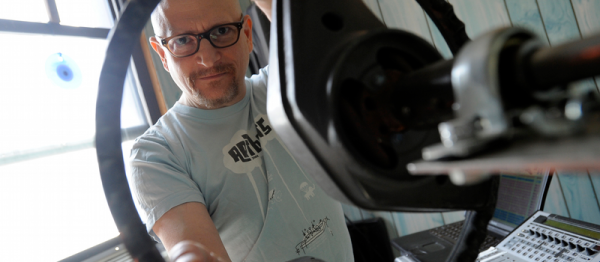
RADIO WONDERLAND is a one-man band with many famous unintentional collaborators. [Joshua Fried]’s shows start off with him walking in carrying a boombox playing FM radio. He plugs it into his sound rig, tunes around a while, and collects some samples. Magic happens, he turns an ancient Buick steering wheel, and music emerges from the resampled radio cacophony.

It’s experimental music, which is secret art-scene-insider code for “you might not like it”, but we love the hacking. In addition to the above-mentioned steering wheel, he also plays a rack of shoes with drumsticks. If we had to guess, we’d say rotary encoders and piezos. All of this is just input for his computer programs which take care of the sampling, chopping, and slicing of live radio into dance music. It’s good enough that he’s opened for [They Might Be Giants].

Check out the videos (embedded below) for a taste of what a live show was like. There are definitely parts where the show is a little slow, but they make it seem cooler when a beat comes together out of found Huey Lewis. We especially like the “re-esser” routine that hones in on the hissier parts of speech to turn them into cymbals. And if you scan the crowd in the beginning, you can find a ten-years-younger [Limor Fried] and [Phil Torrone].

Continue reading “Pulling Music Out Of The Airwaves”